Quickstart
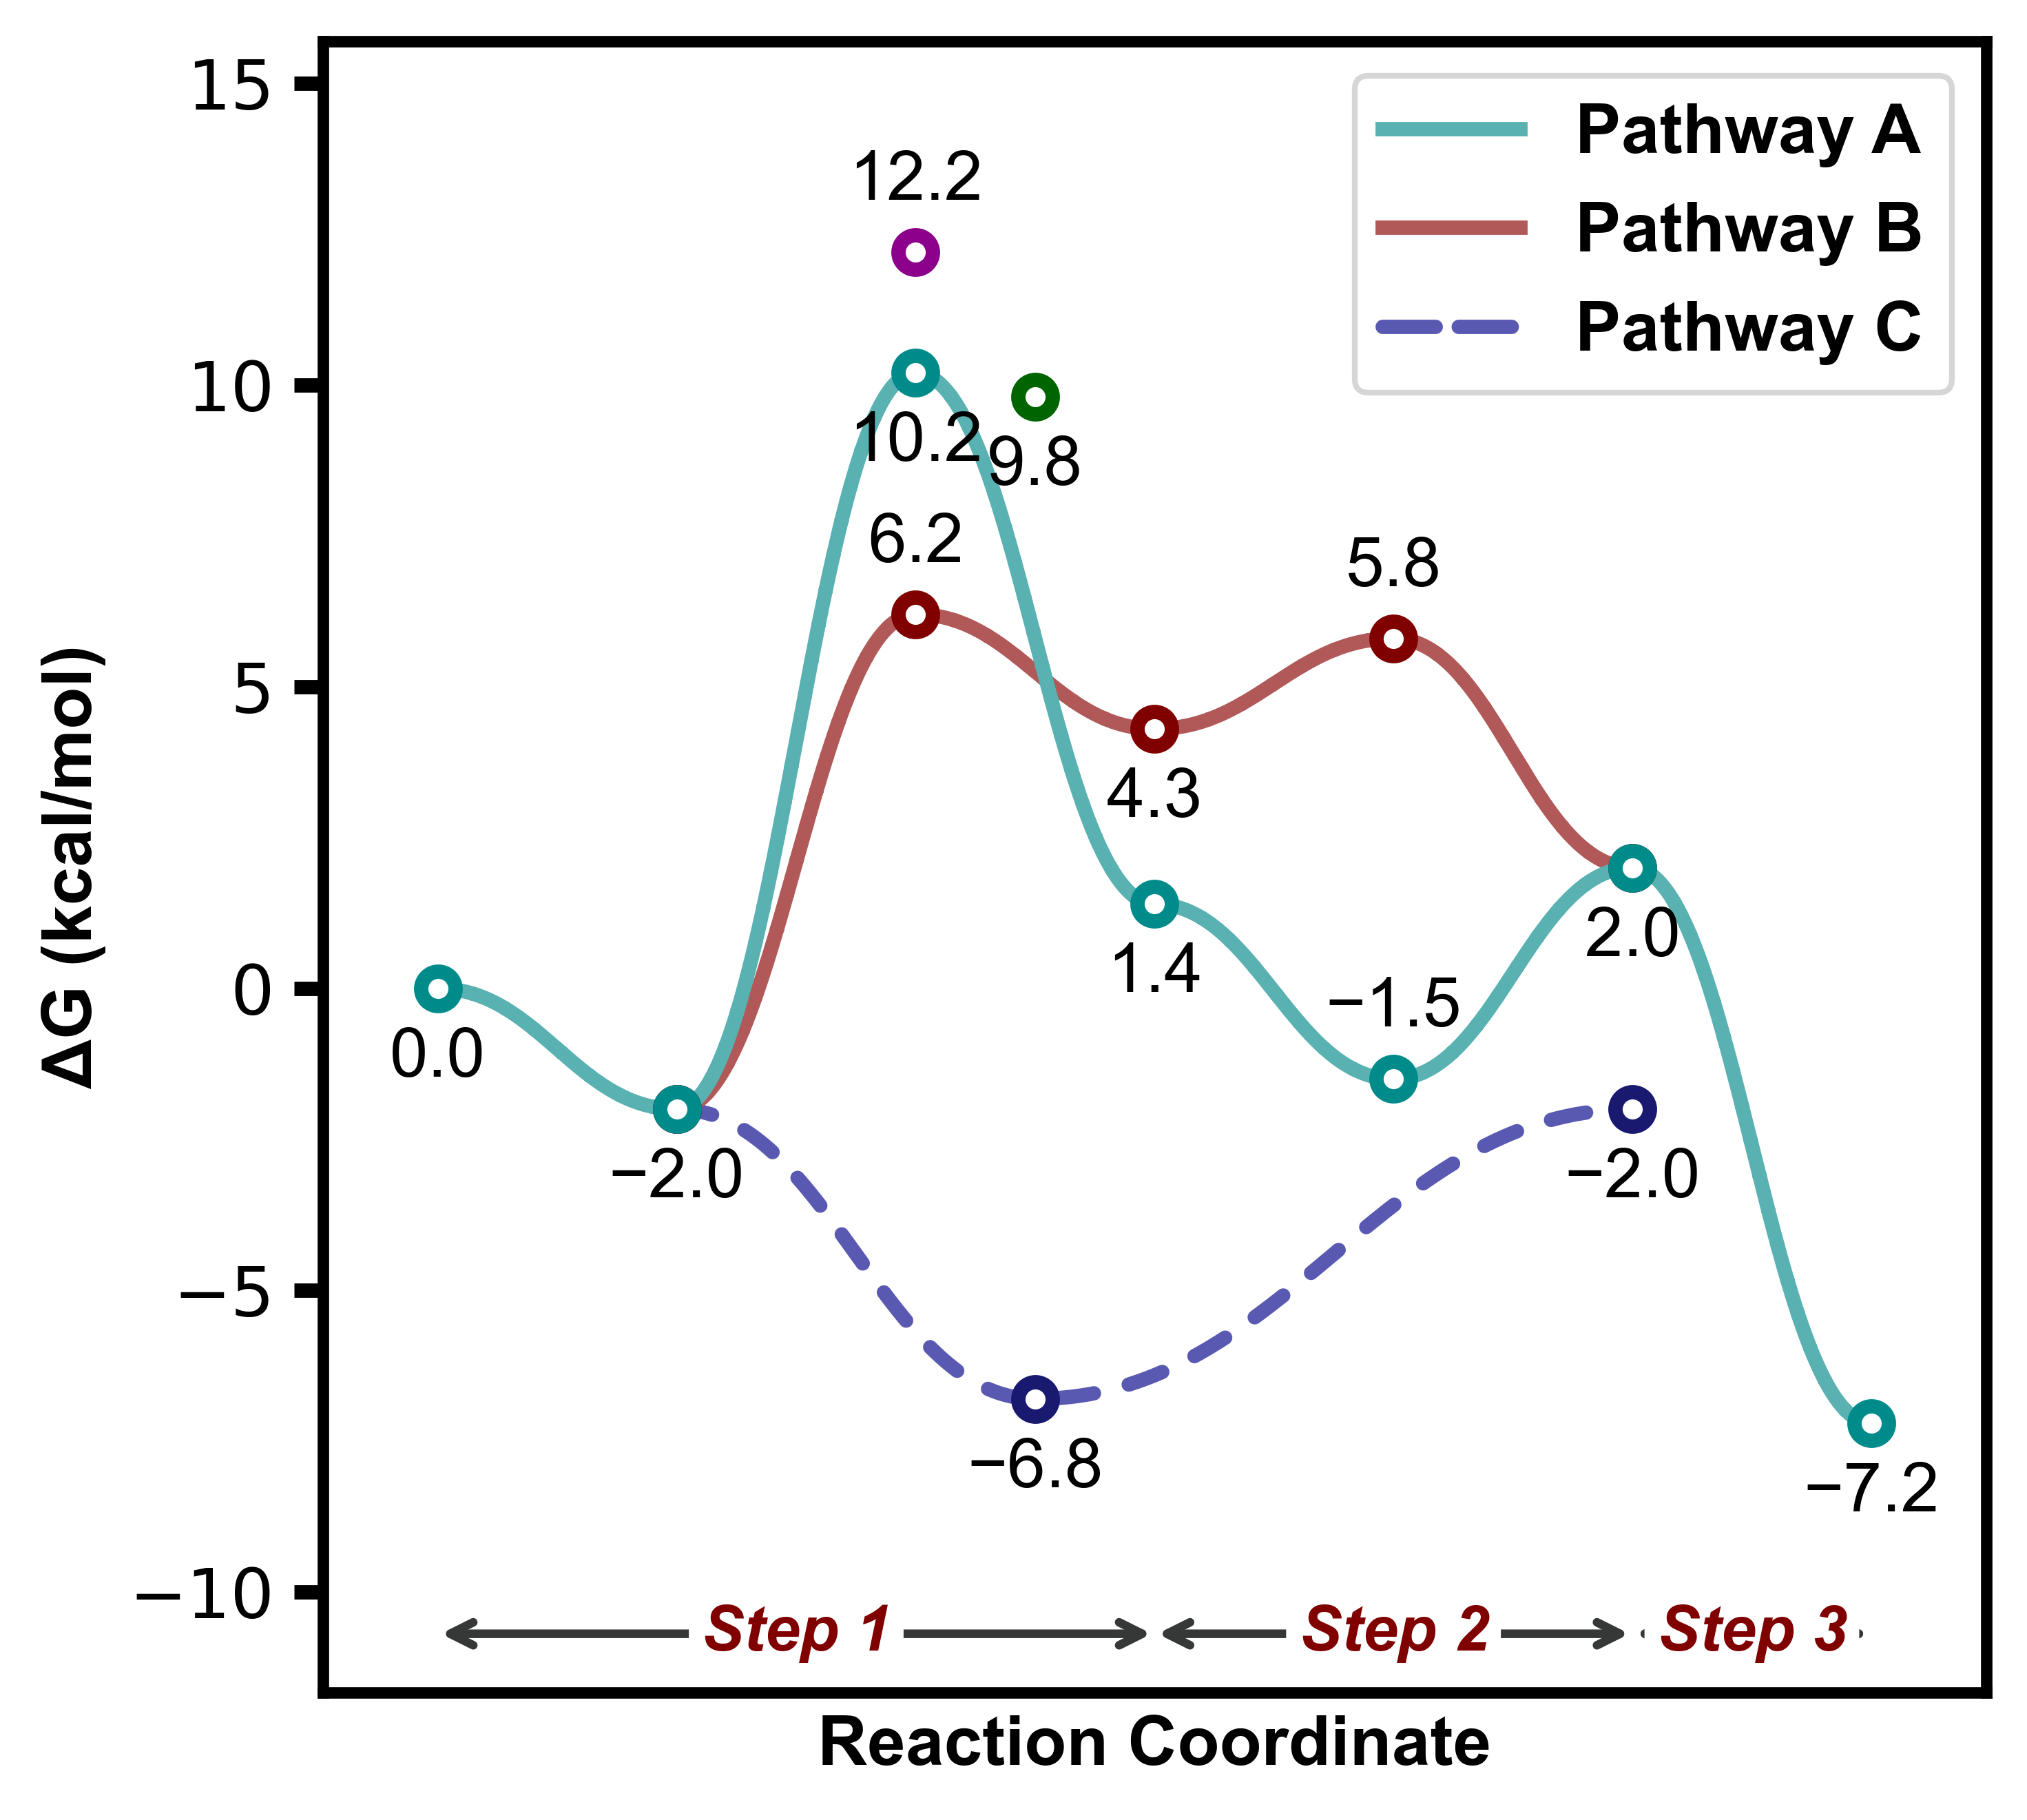
Example 1
from plotProfile import ReactionProfilePlotter

energy_sets = {
    "Pathway A": [0.00, -2.0, 10.2, 1.4, -1.5, 2.0, -7.2],
    "Pathway B": [None, -2.0, 6.2, 4.3, 5.8, 2.0],
    "Pathway C": [None, -2.0, -6.8,-6.8, None, -2.0],
    "diastereomer": [None, None, 12.2],
    "diastereomer2": [None, None, 9.8, 9.8]
}
annotations = {
    'Step 1': (0,3),
    'Step 2': (3,5),
    'Step 3': (5,6),
}

plotter = ReactionProfilePlotter(dashed=["Pathway C"])
plotter.plot(energy_sets, annotations=annotations, filename="../images/profile1")
Passing in annotations for labelling of the reaction profile:
this is done in the plotting function rather than the class
using dictionary with keys of labels and a tuple of the start and end x-indices
allowing for multiple plots of the same style with different annotations
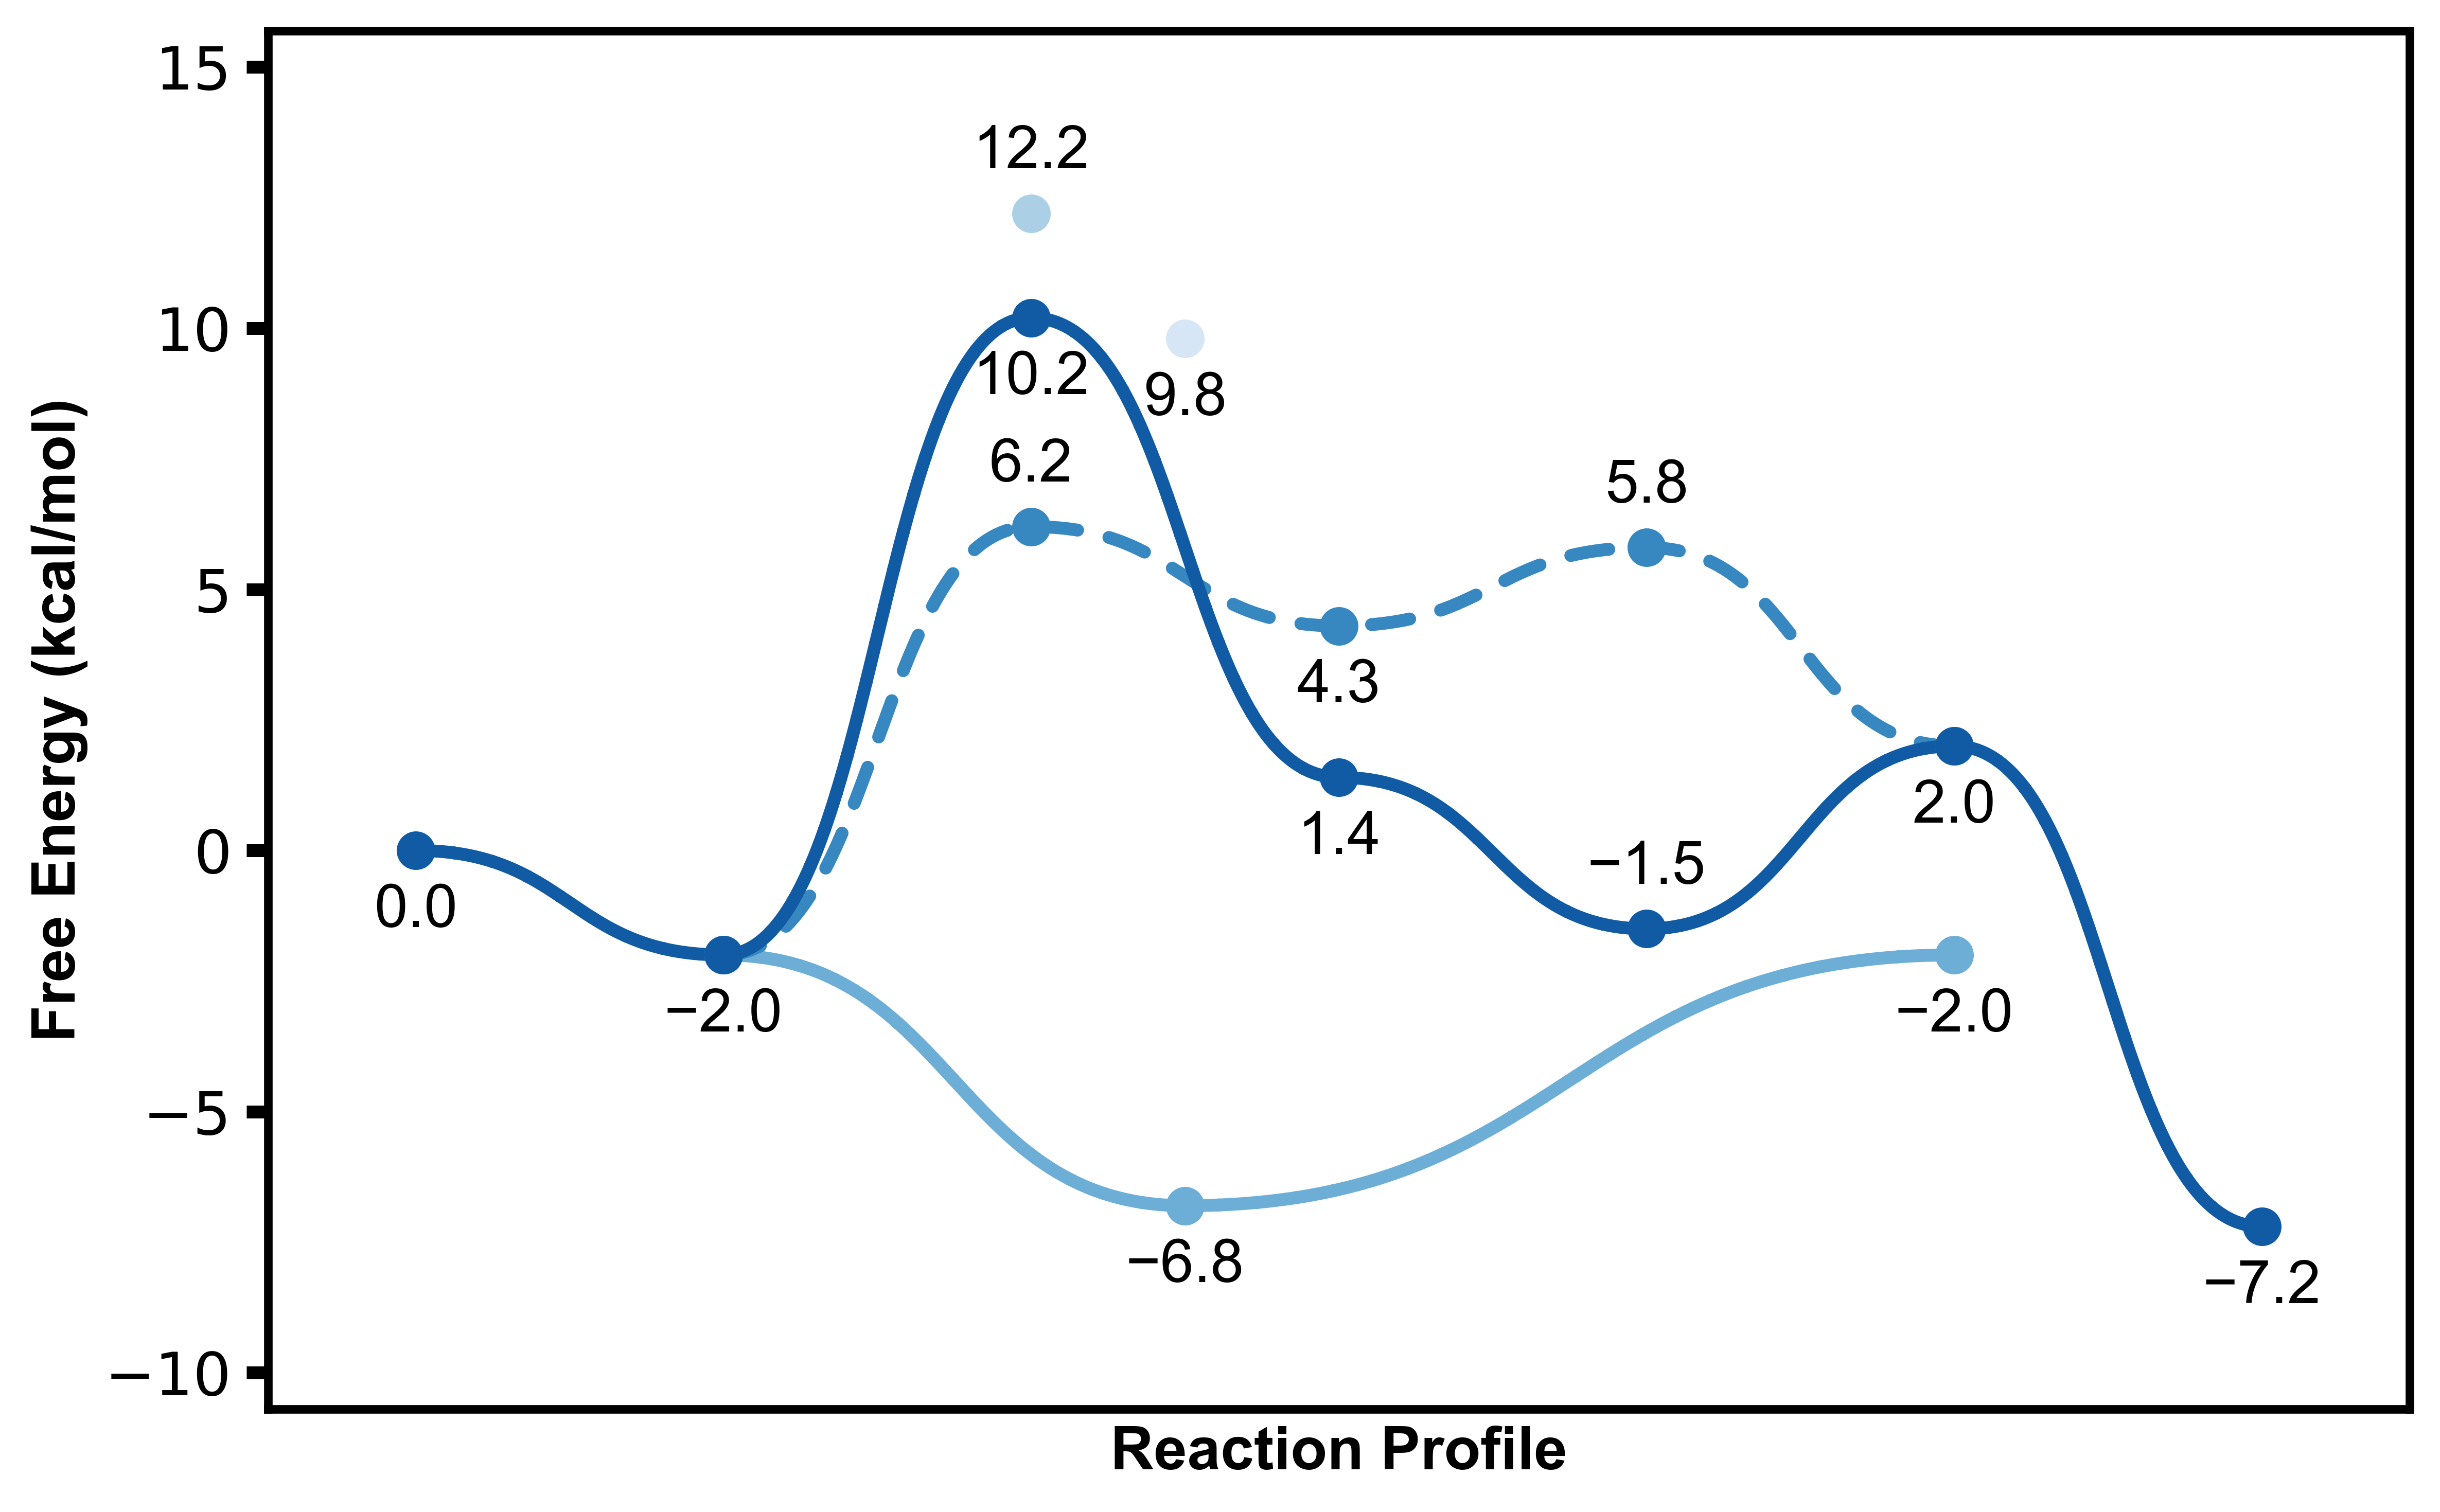
Example 2
Using style="presentation" which sets a larger figsize=(X,X) with thicker lines and a larger font size:
plotter = ReactionProfilePlotter(style="presentation", dashed=["Pathway B"], point_type='dot', desaturate=False, colors='Blues_r', show_legend=False, curviness=0.5, x_label='Reaction Profile', y_label='Free Energy (kcal/mol)')
plotter.plot(energy_sets, filename="../images/profile2")
A variety of other paremters can be tuned for the plotting, including:
axes="box|y|x|both|None"curviness=0.42- reduce for less curve and vice versacolors=["list","of","colors"]|cmap- specify colour list or colour mapif the colour list is too short then colours will be repeated.
if the cmap is invalid,
viridiswill be set as a default
show_legend=Boolunits="kj|kcal"energy="e|electronic|g|gibbs|h|enthalpy|s|entropy|"x_labelandy_labelcan be used to set cutoms axis labels, superceedingunitsorenergy
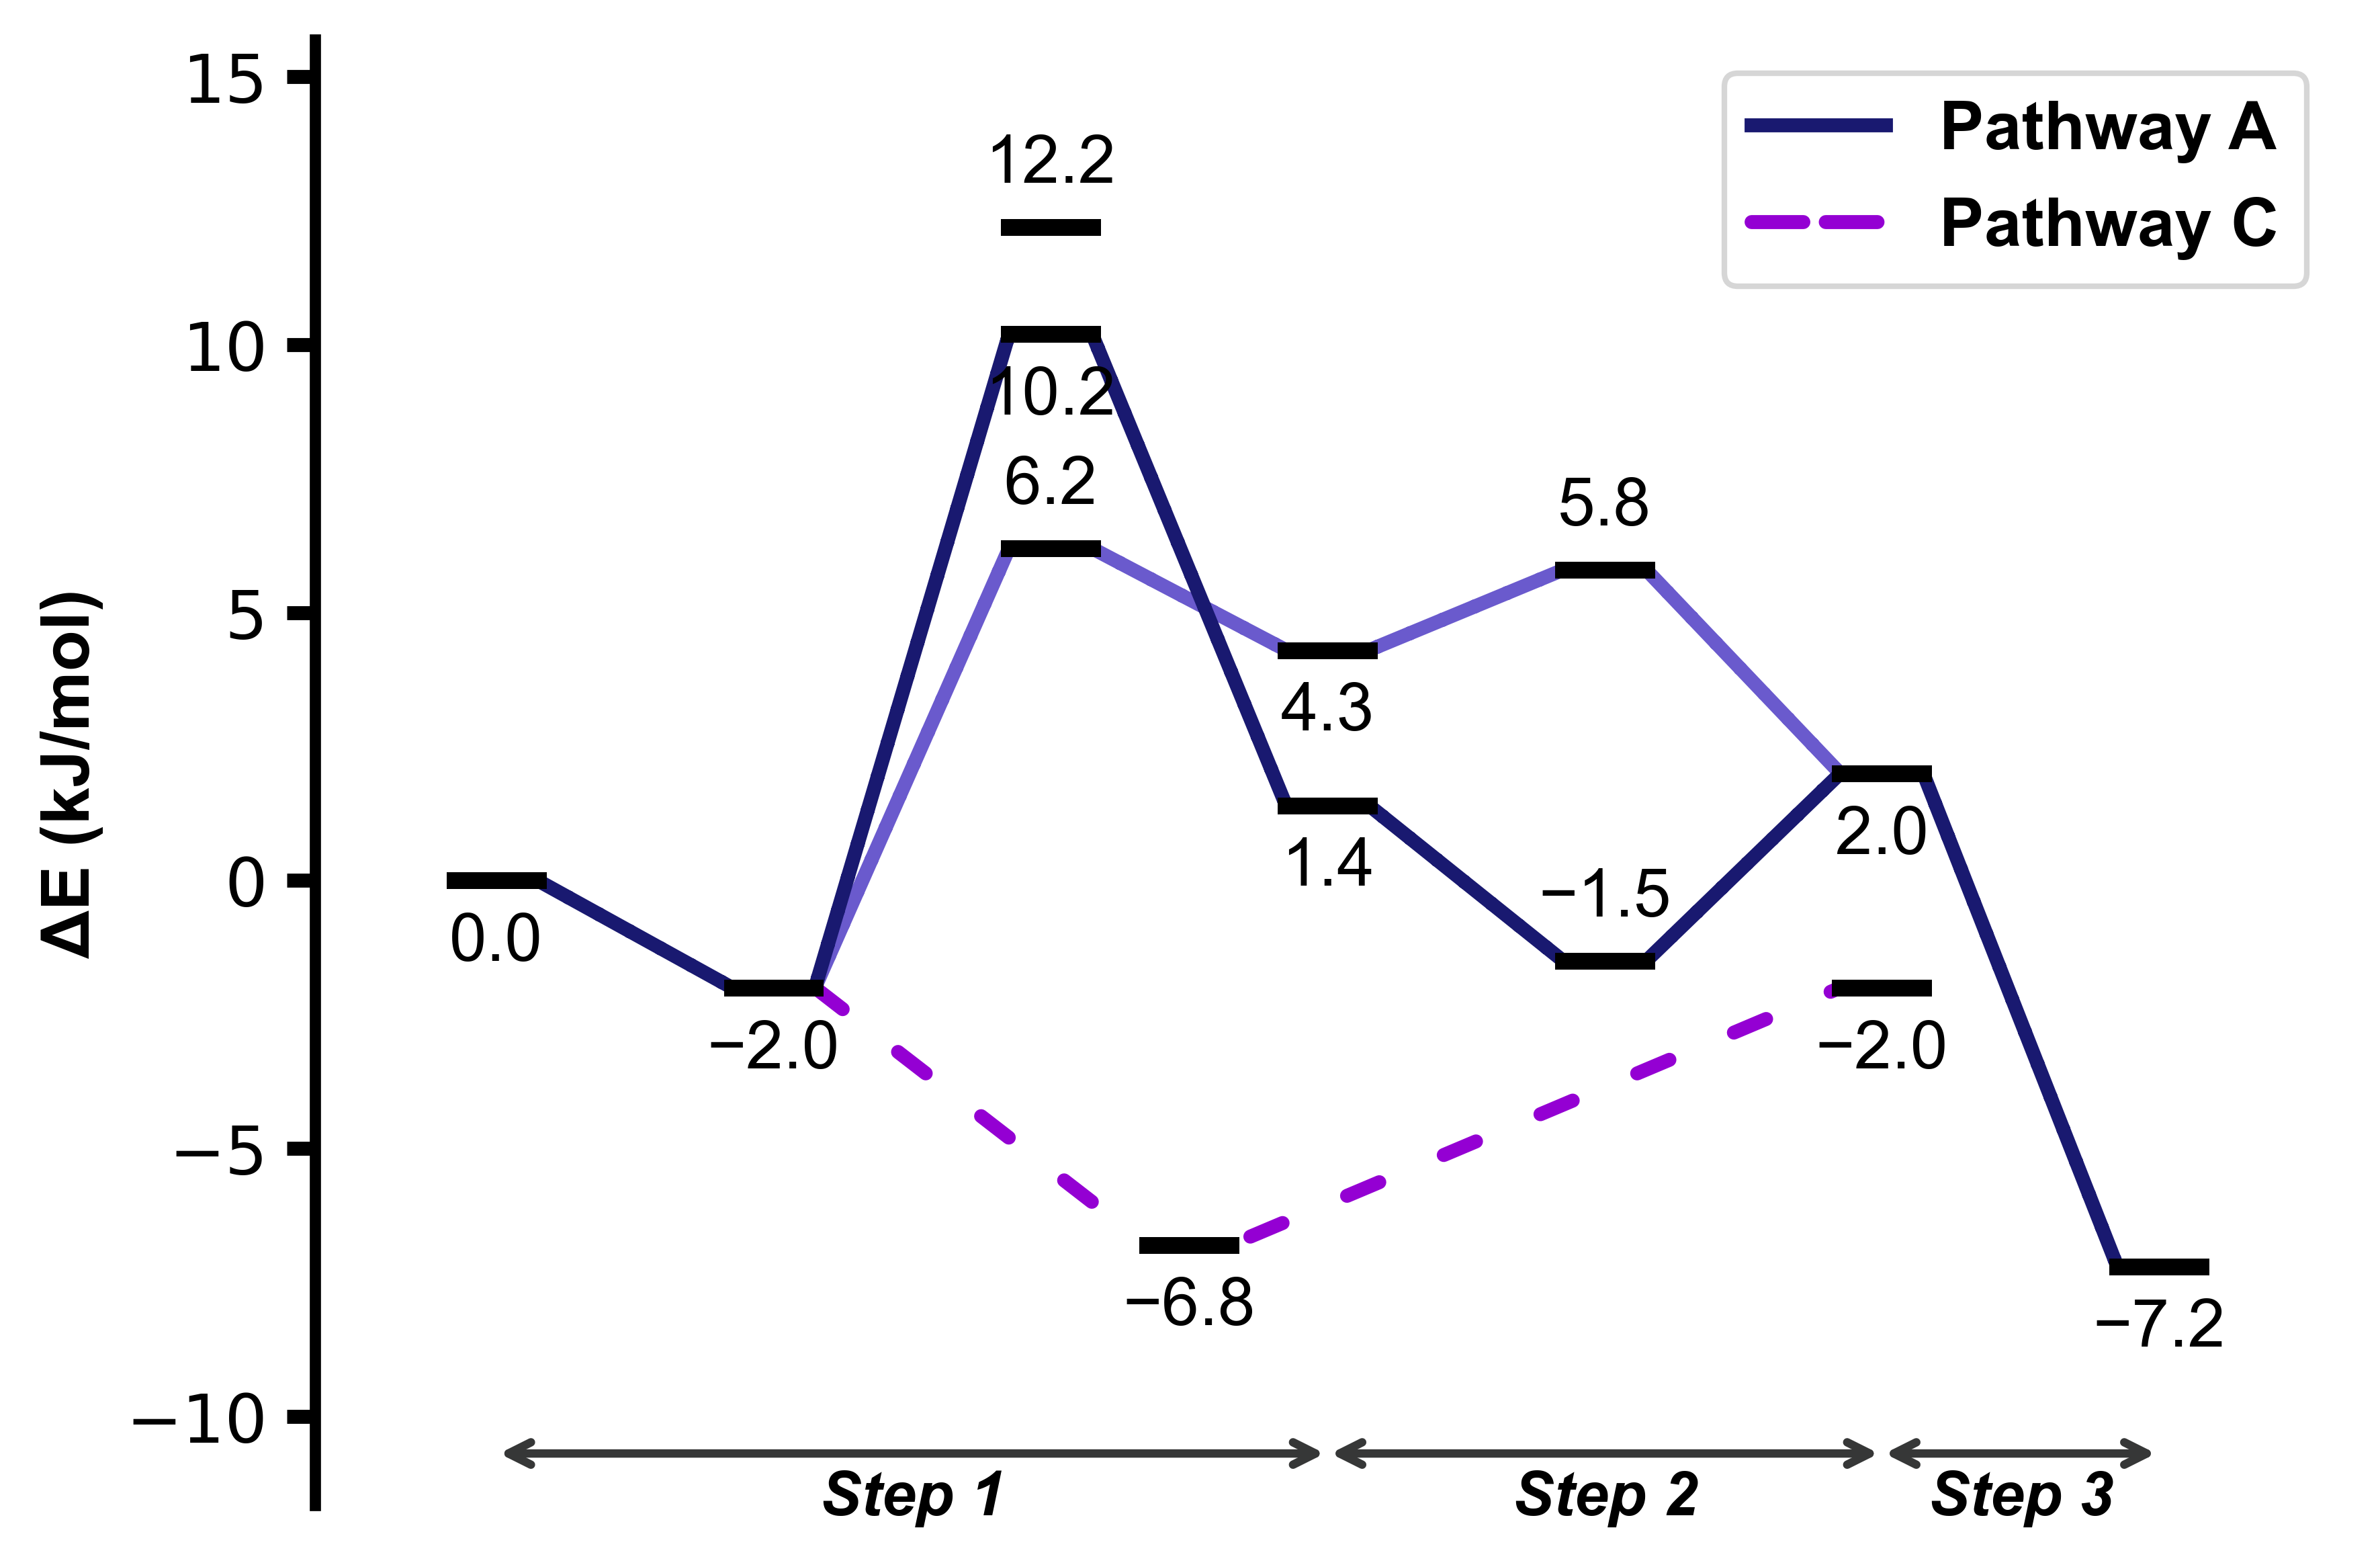
Example 3
plotter = ReactionProfilePlotter(style="straight", figsize=(6,4), dashed=["Pathway C"], point_type='bar', annotation_color='black', axes='y', colors=['midnightblue', 'slateblue', 'darkviolet'], energy='electronic', units='kj', annotation_below_arrow=True, dash_spacing=5.0, desaturate=False)
plotter.plot(energy_sets, annotations=annotations, filename="../images/profile3", exclude_from_legend=["Pathway B"], include_keys=["Pathway A", "Pathway B", "Pathway C", "diastereomer"])
Straight lines set in a style, which can also be done by passing in
curviness=0Labels can be placed below the annotation arrow
Some parameters regarding the plotting data can be tuned in
ReactionProfilePlotter.plot:include_keys- only some of the energy_sets keys() included in the plotexclude_from_legend- excluded one of the energy_sets key from the legend
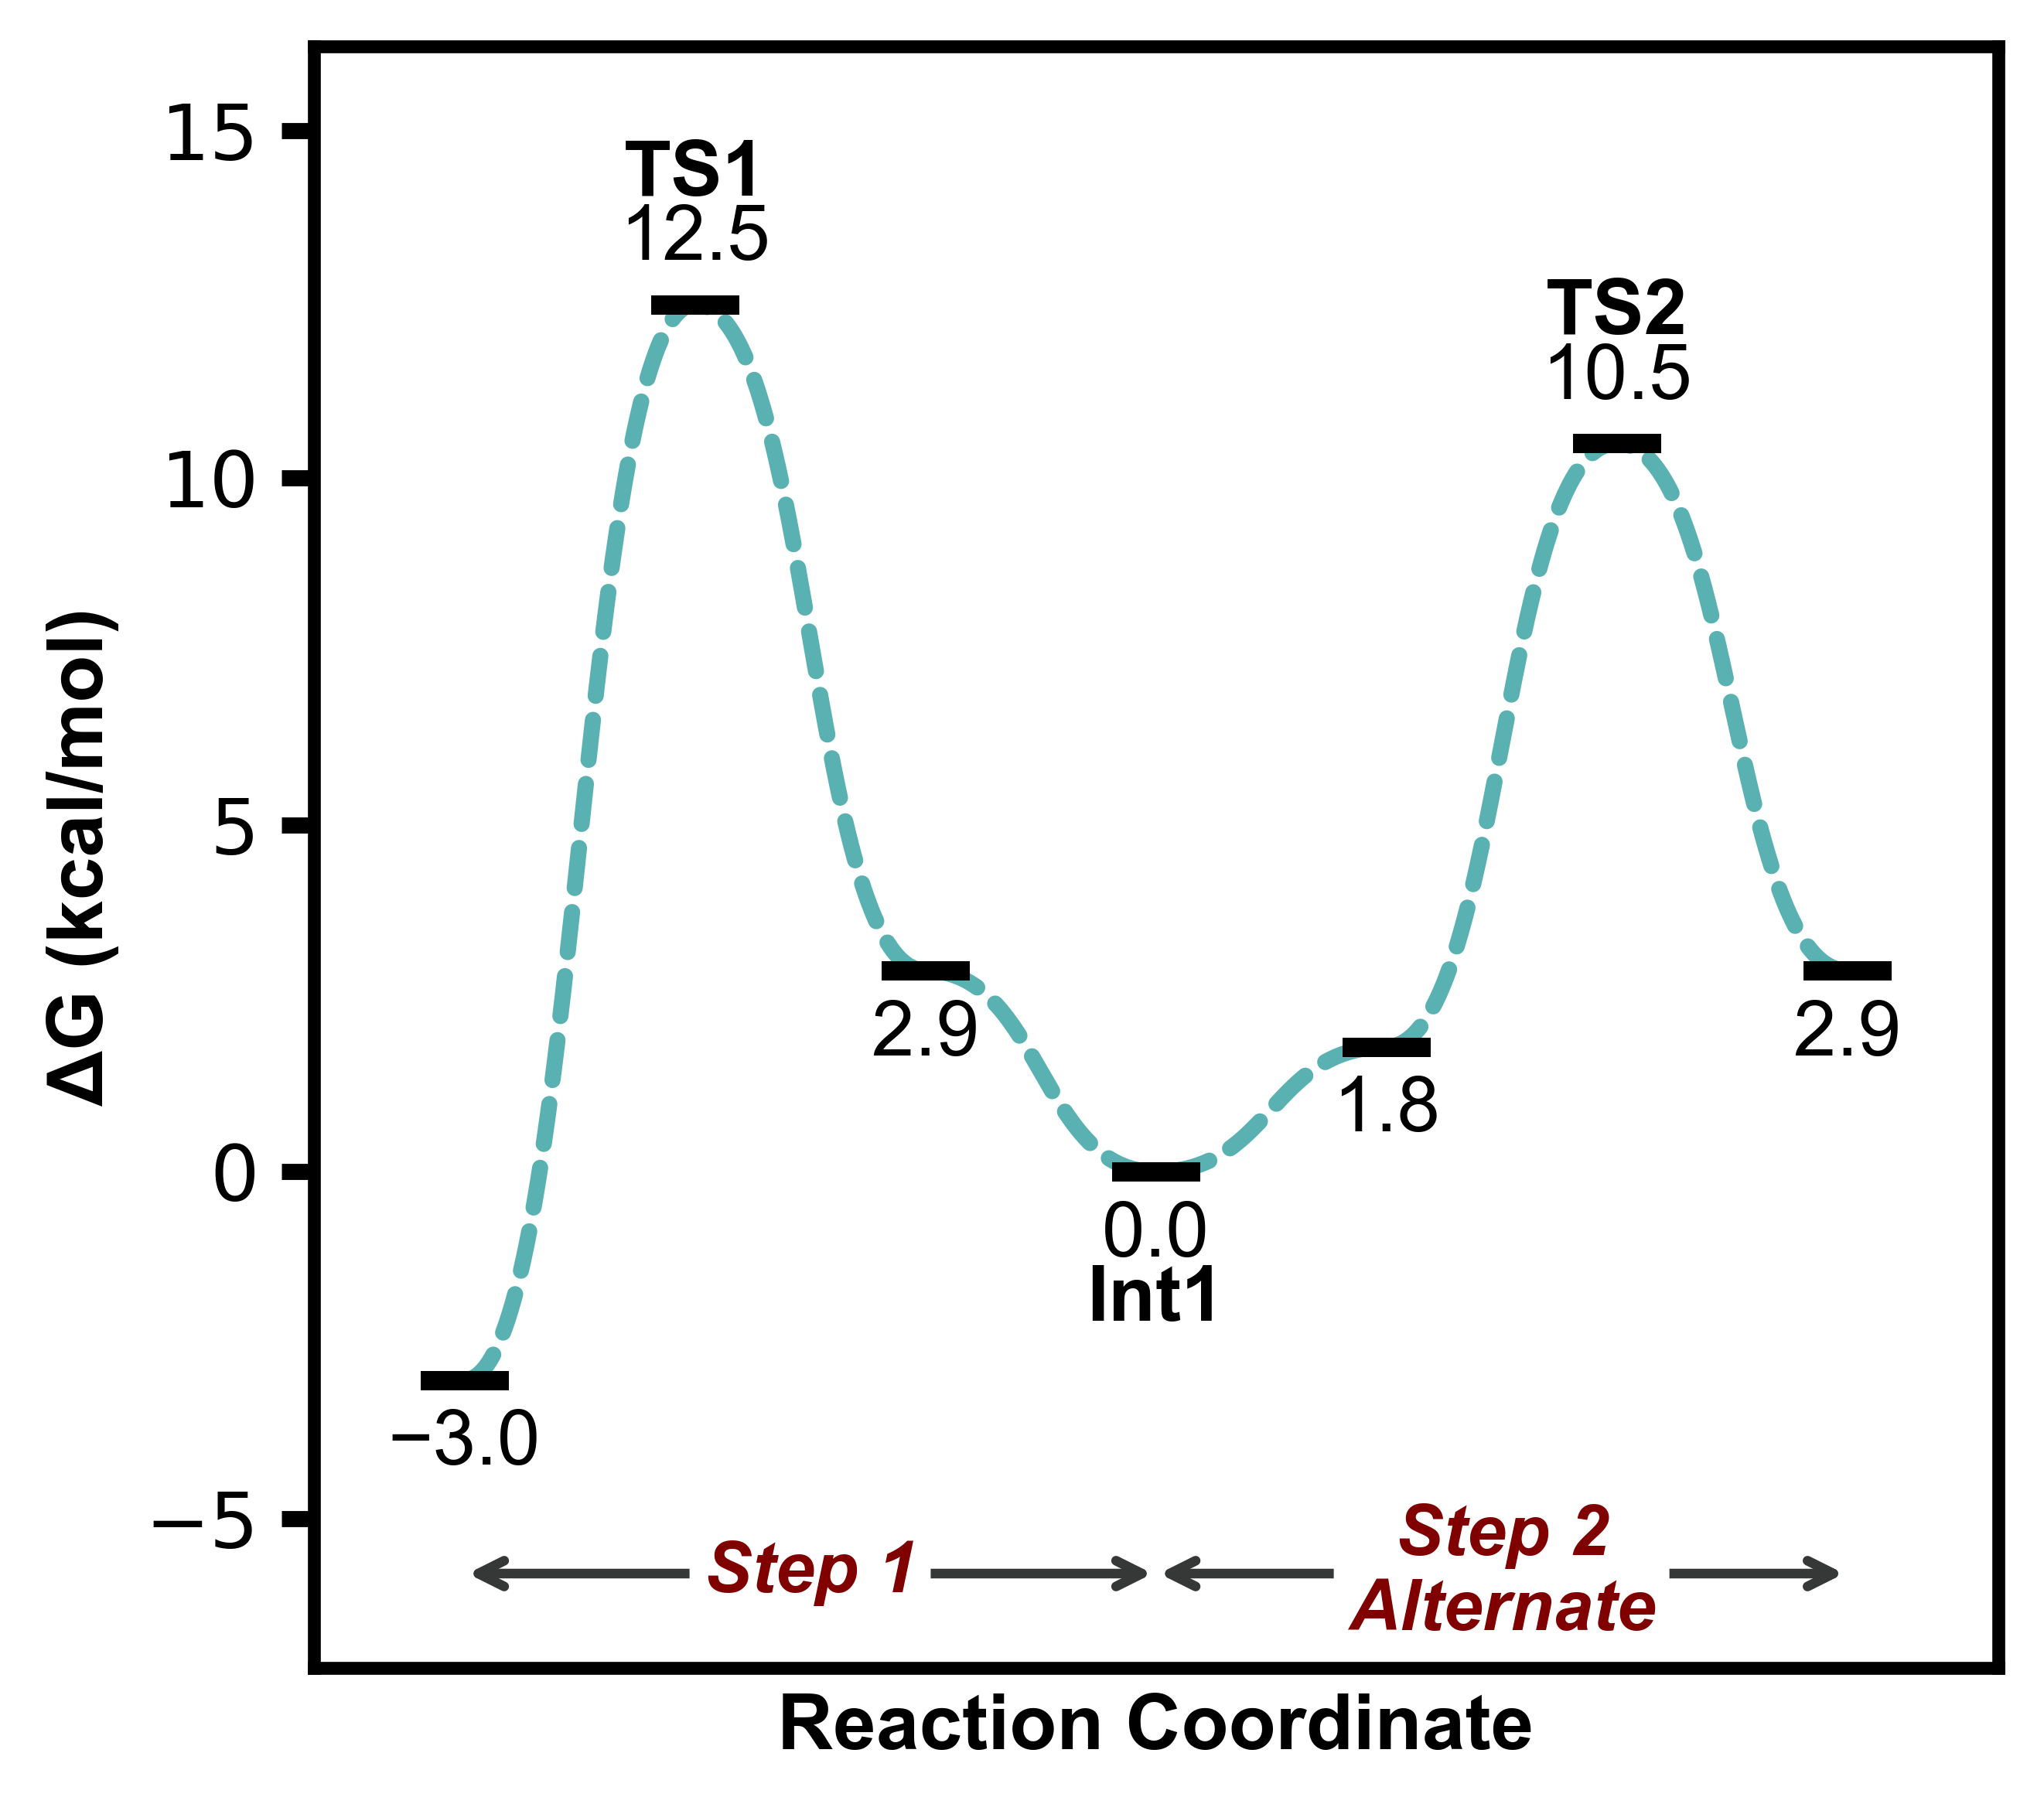
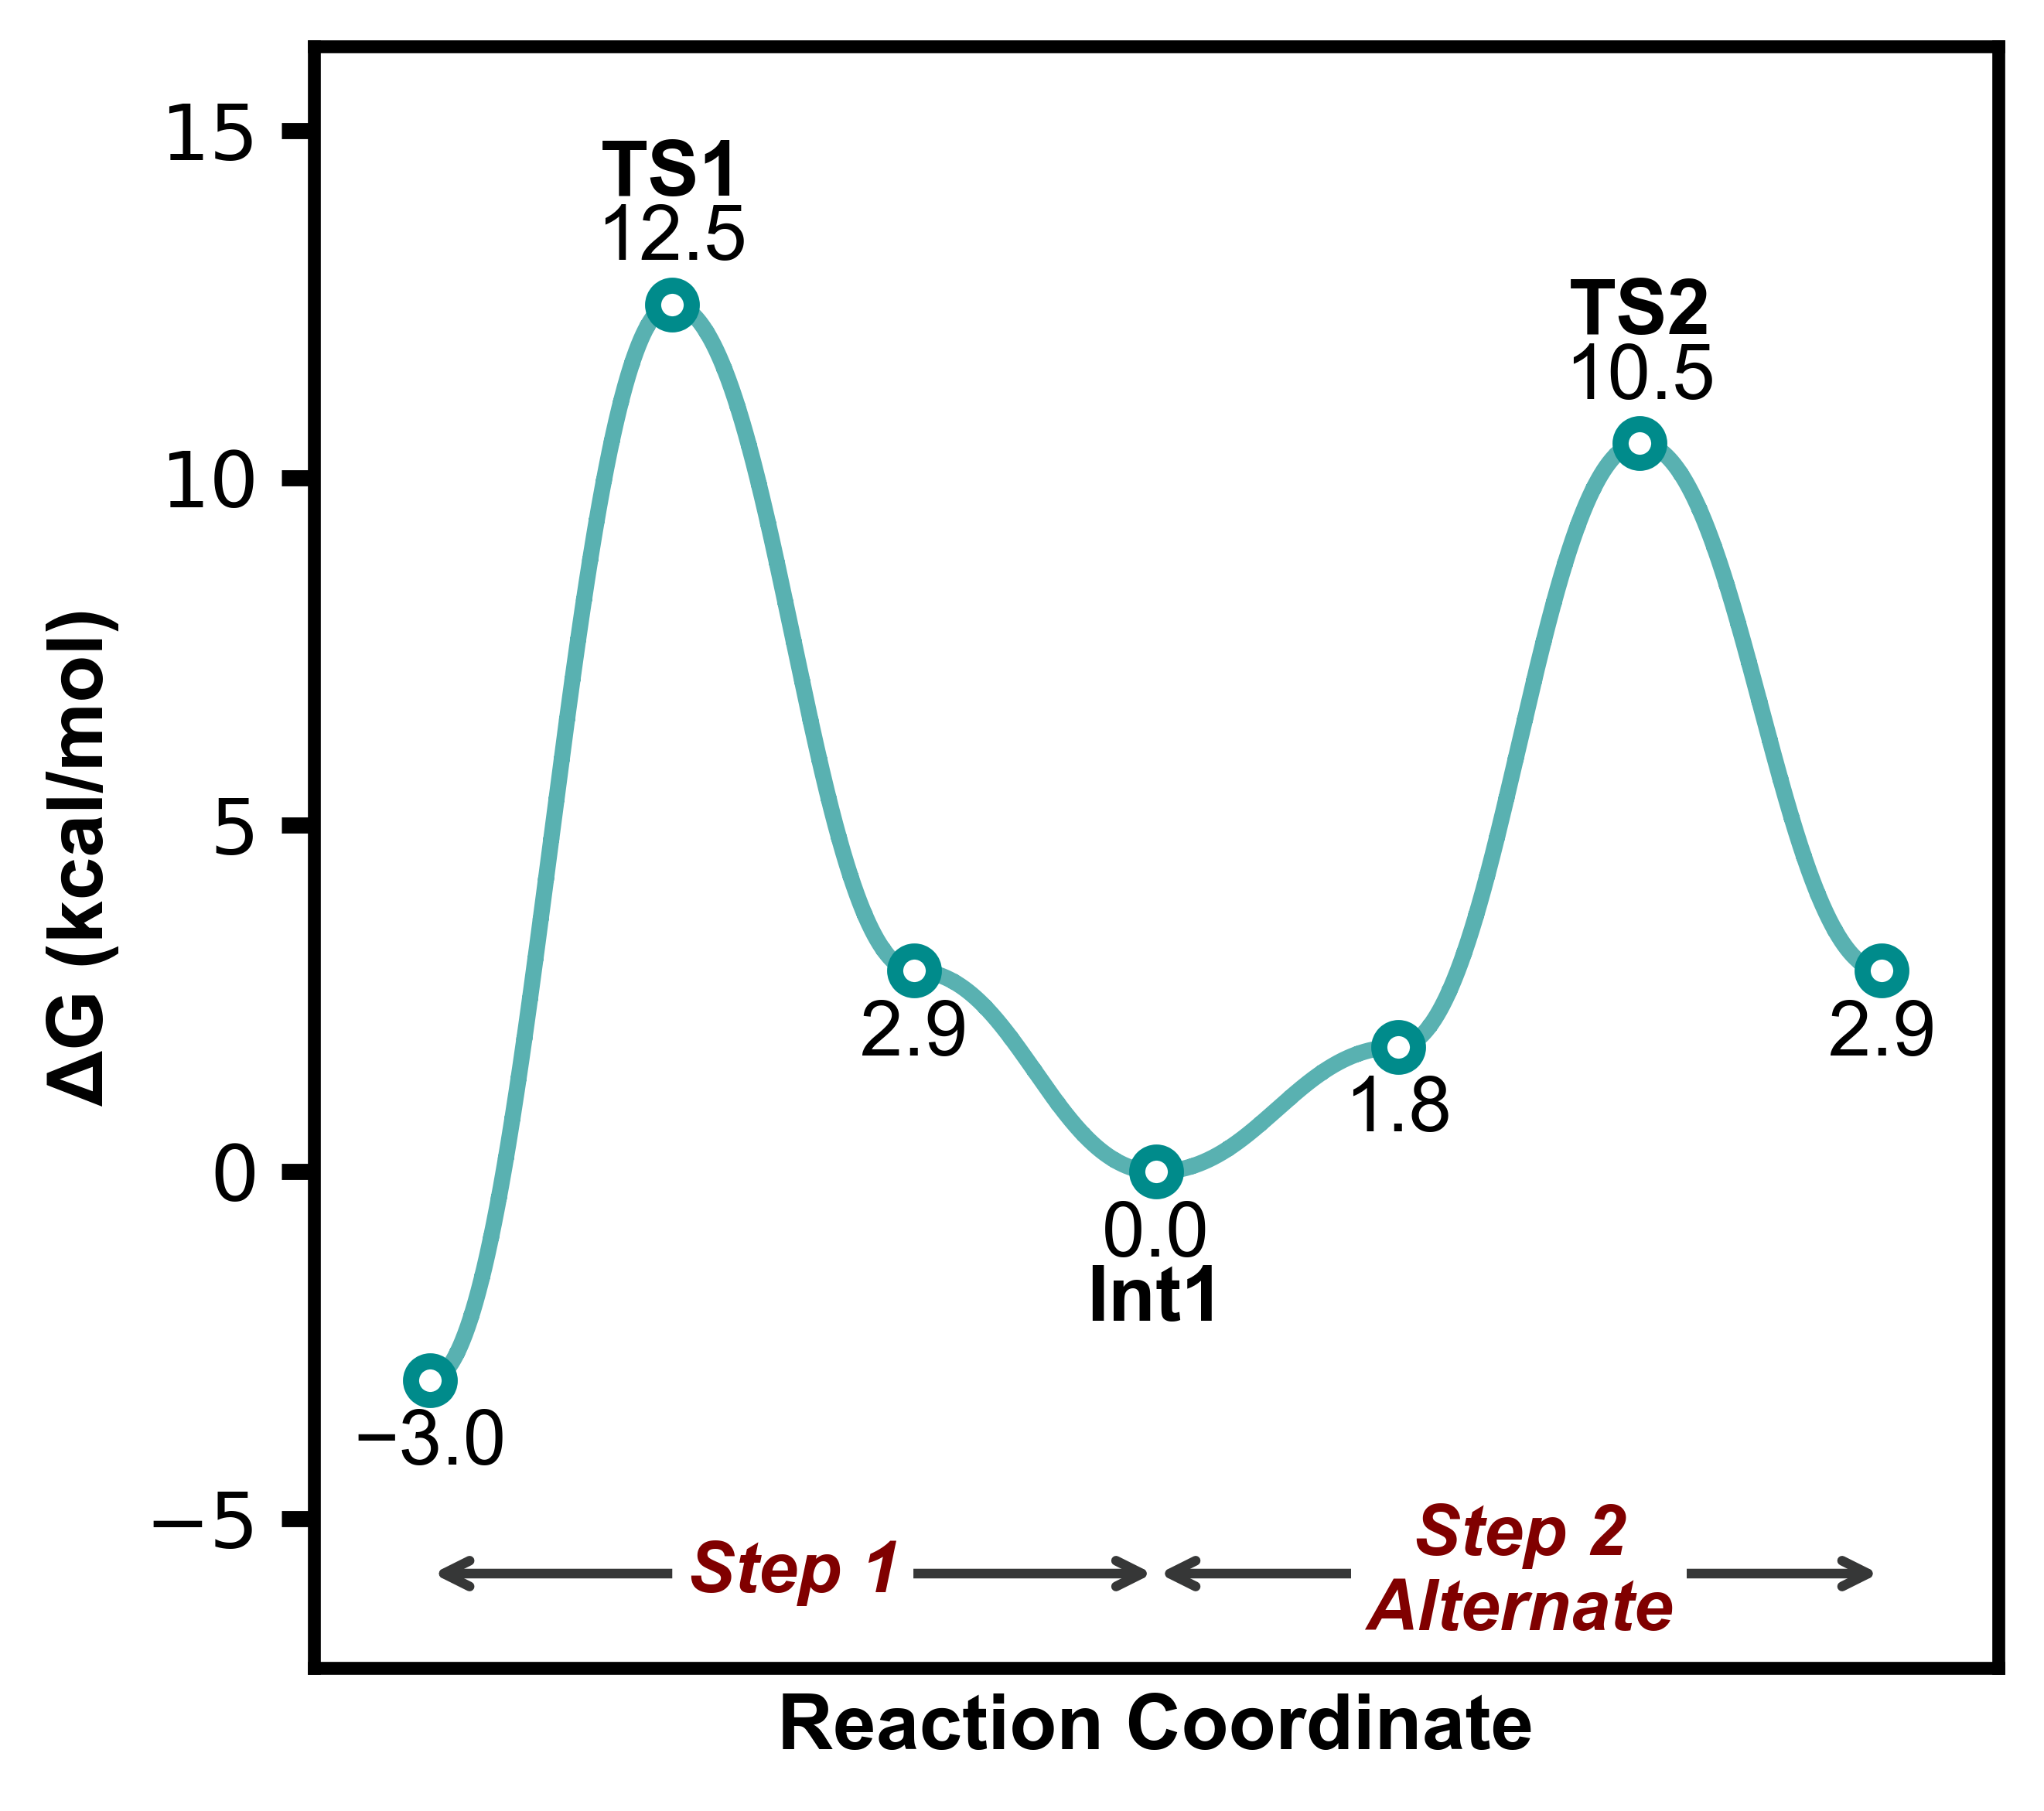
Example 4
energy_sets = {
    "1": [-3.0, 12.5, 2.9, 0.0, 1.8, 10.5, 2.9]
}

annotations = {
    'Step 1': (0,3),
    'Step 2\nAlternate': (3,6),
}

point_labels = {
    "1": [None, "TS1", None, "Int1", None, "TS2"]
}

plotter = ReactionProfilePlotter(figsize=(4.5,4), axes='box', show_legend=False)
plotter.plot(energy_sets, annotations=annotations, point_labels=point_labels, filename="../images/profile4")
Point labels can be also added by passing
point_labelstoReactionProfilePlotter.plotAnnotations can accommodate newline characters
\nand spacing will be adjusted automatically
Example 5
energy_sets = {
    "1": [-3.0, 12.5, 2.9, 0.0, 1.8, 10.5, 2.9]
}

annotations = {
    'Step 1': (0,3),
    'Step 2\nAlternate': (3,6),
}

point_labels = {
    "1": [None, "TS1", None, "Int1", None, "TS2"]
}

plotter = ReactionProfilePlotter(figsize=(4.5,4), axes='box', curviness=0.5, show_legend=False, point_type='bar', bar_length=0.3, bar_width=3, connect_bar_ends=False, dashed=["1"], dash_spacing=1.5)
plotter.plot(energy_sets, annotations=annotations, point_labels=point_labels, filename="../images/profile5")
Bar lengths and widths can be adjusted
Default line/curve behaviour with bars is to connect at the edges, this can be turned off with
connect_bar_ends=FalseDash spacing of the line can be changed with
dash_spacing