plotProfile documentation
Welcome to the plotProfile documentation! This package provides tools for visualizing reaction profile energies.
Features
- 🎯 Professional Publication-Ready Plots
Generate high-quality reaction profiles suitable for journals and presentations
- 🔧 Extensive Customization
Colors, line styles, annotations, units, and layout options
- 📊 Flexible Data Input
Support for multiple reaction pathways, diastereomers, and individual transition states
- 🚀 Easy Integration
Works seamlessly with Jupyter notebooks and Python scripts
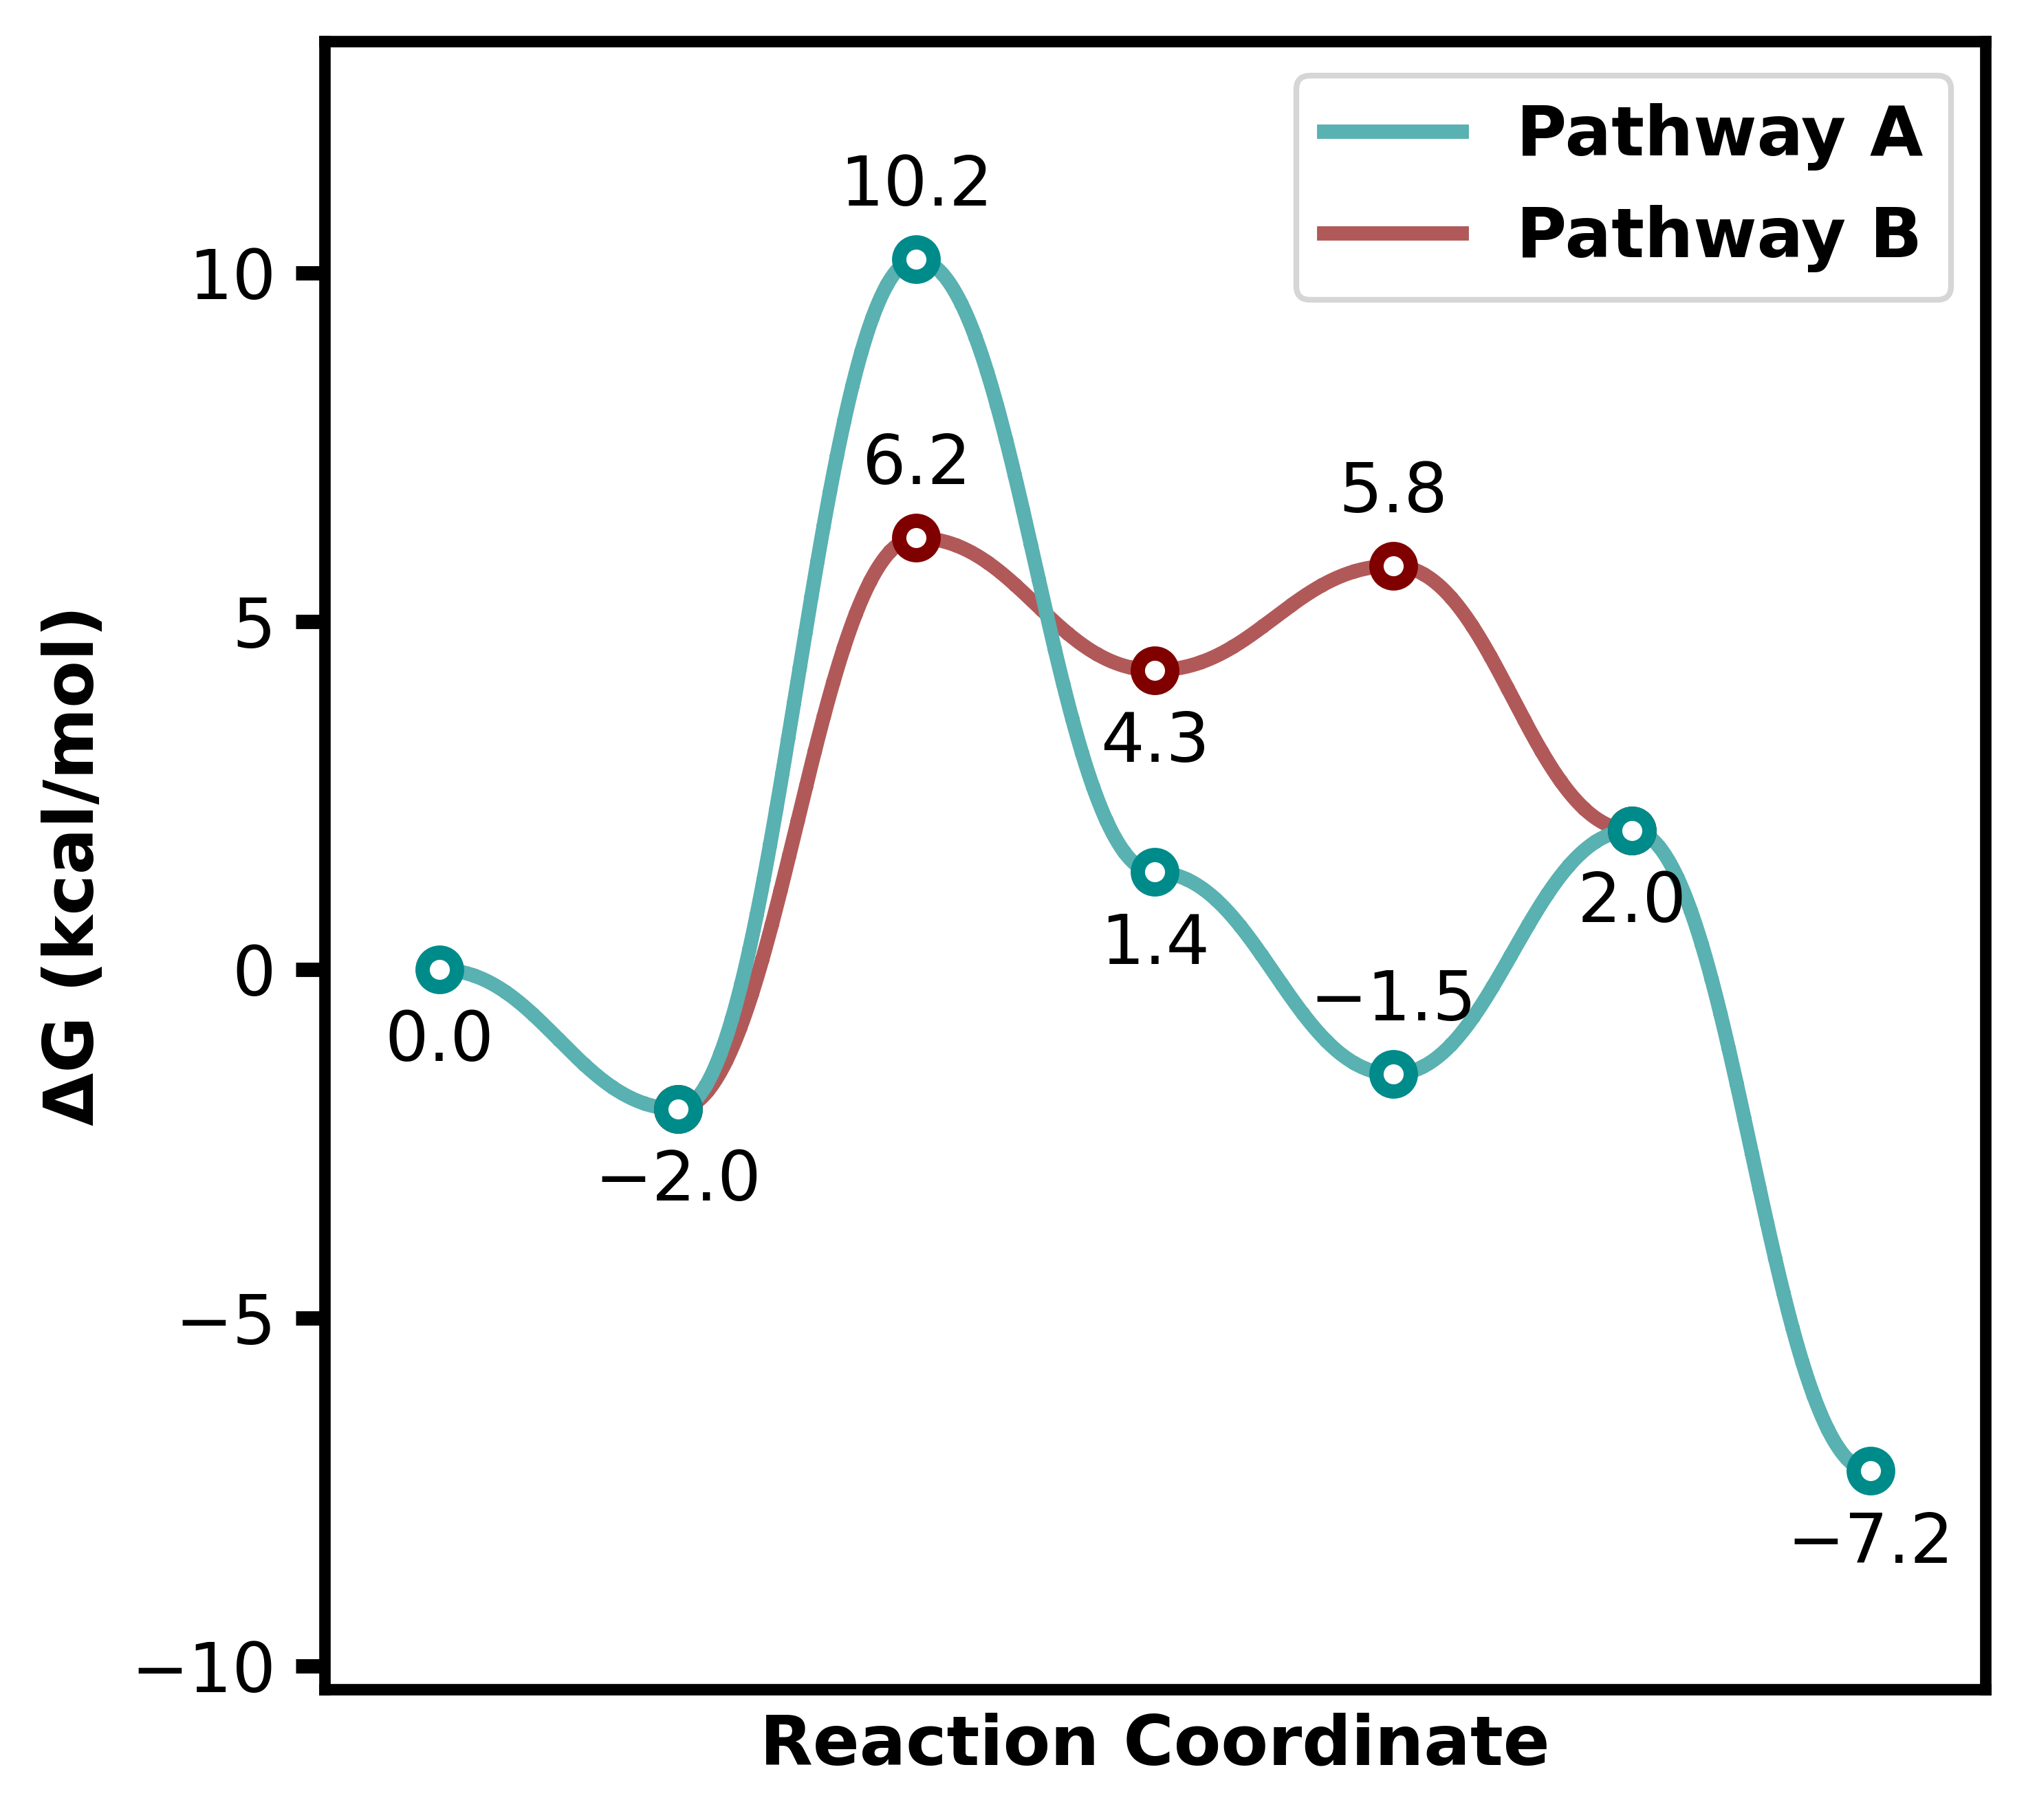
Quick Example
from plotProfile import ReactionProfilePlotter

energy_sets = {
    "Pathway A": [0.00, -2.0, 10.2, 1.4, -1.5, 2.0, -7.2],
    "Pathway B": [None, -2.0, 6.2, 4.3, 5.8, 2.0],
}

plotter = ReactionProfilePlotter()
plotter.plot(energy_sets, filename="../images/profile0")