plotprofile documentation
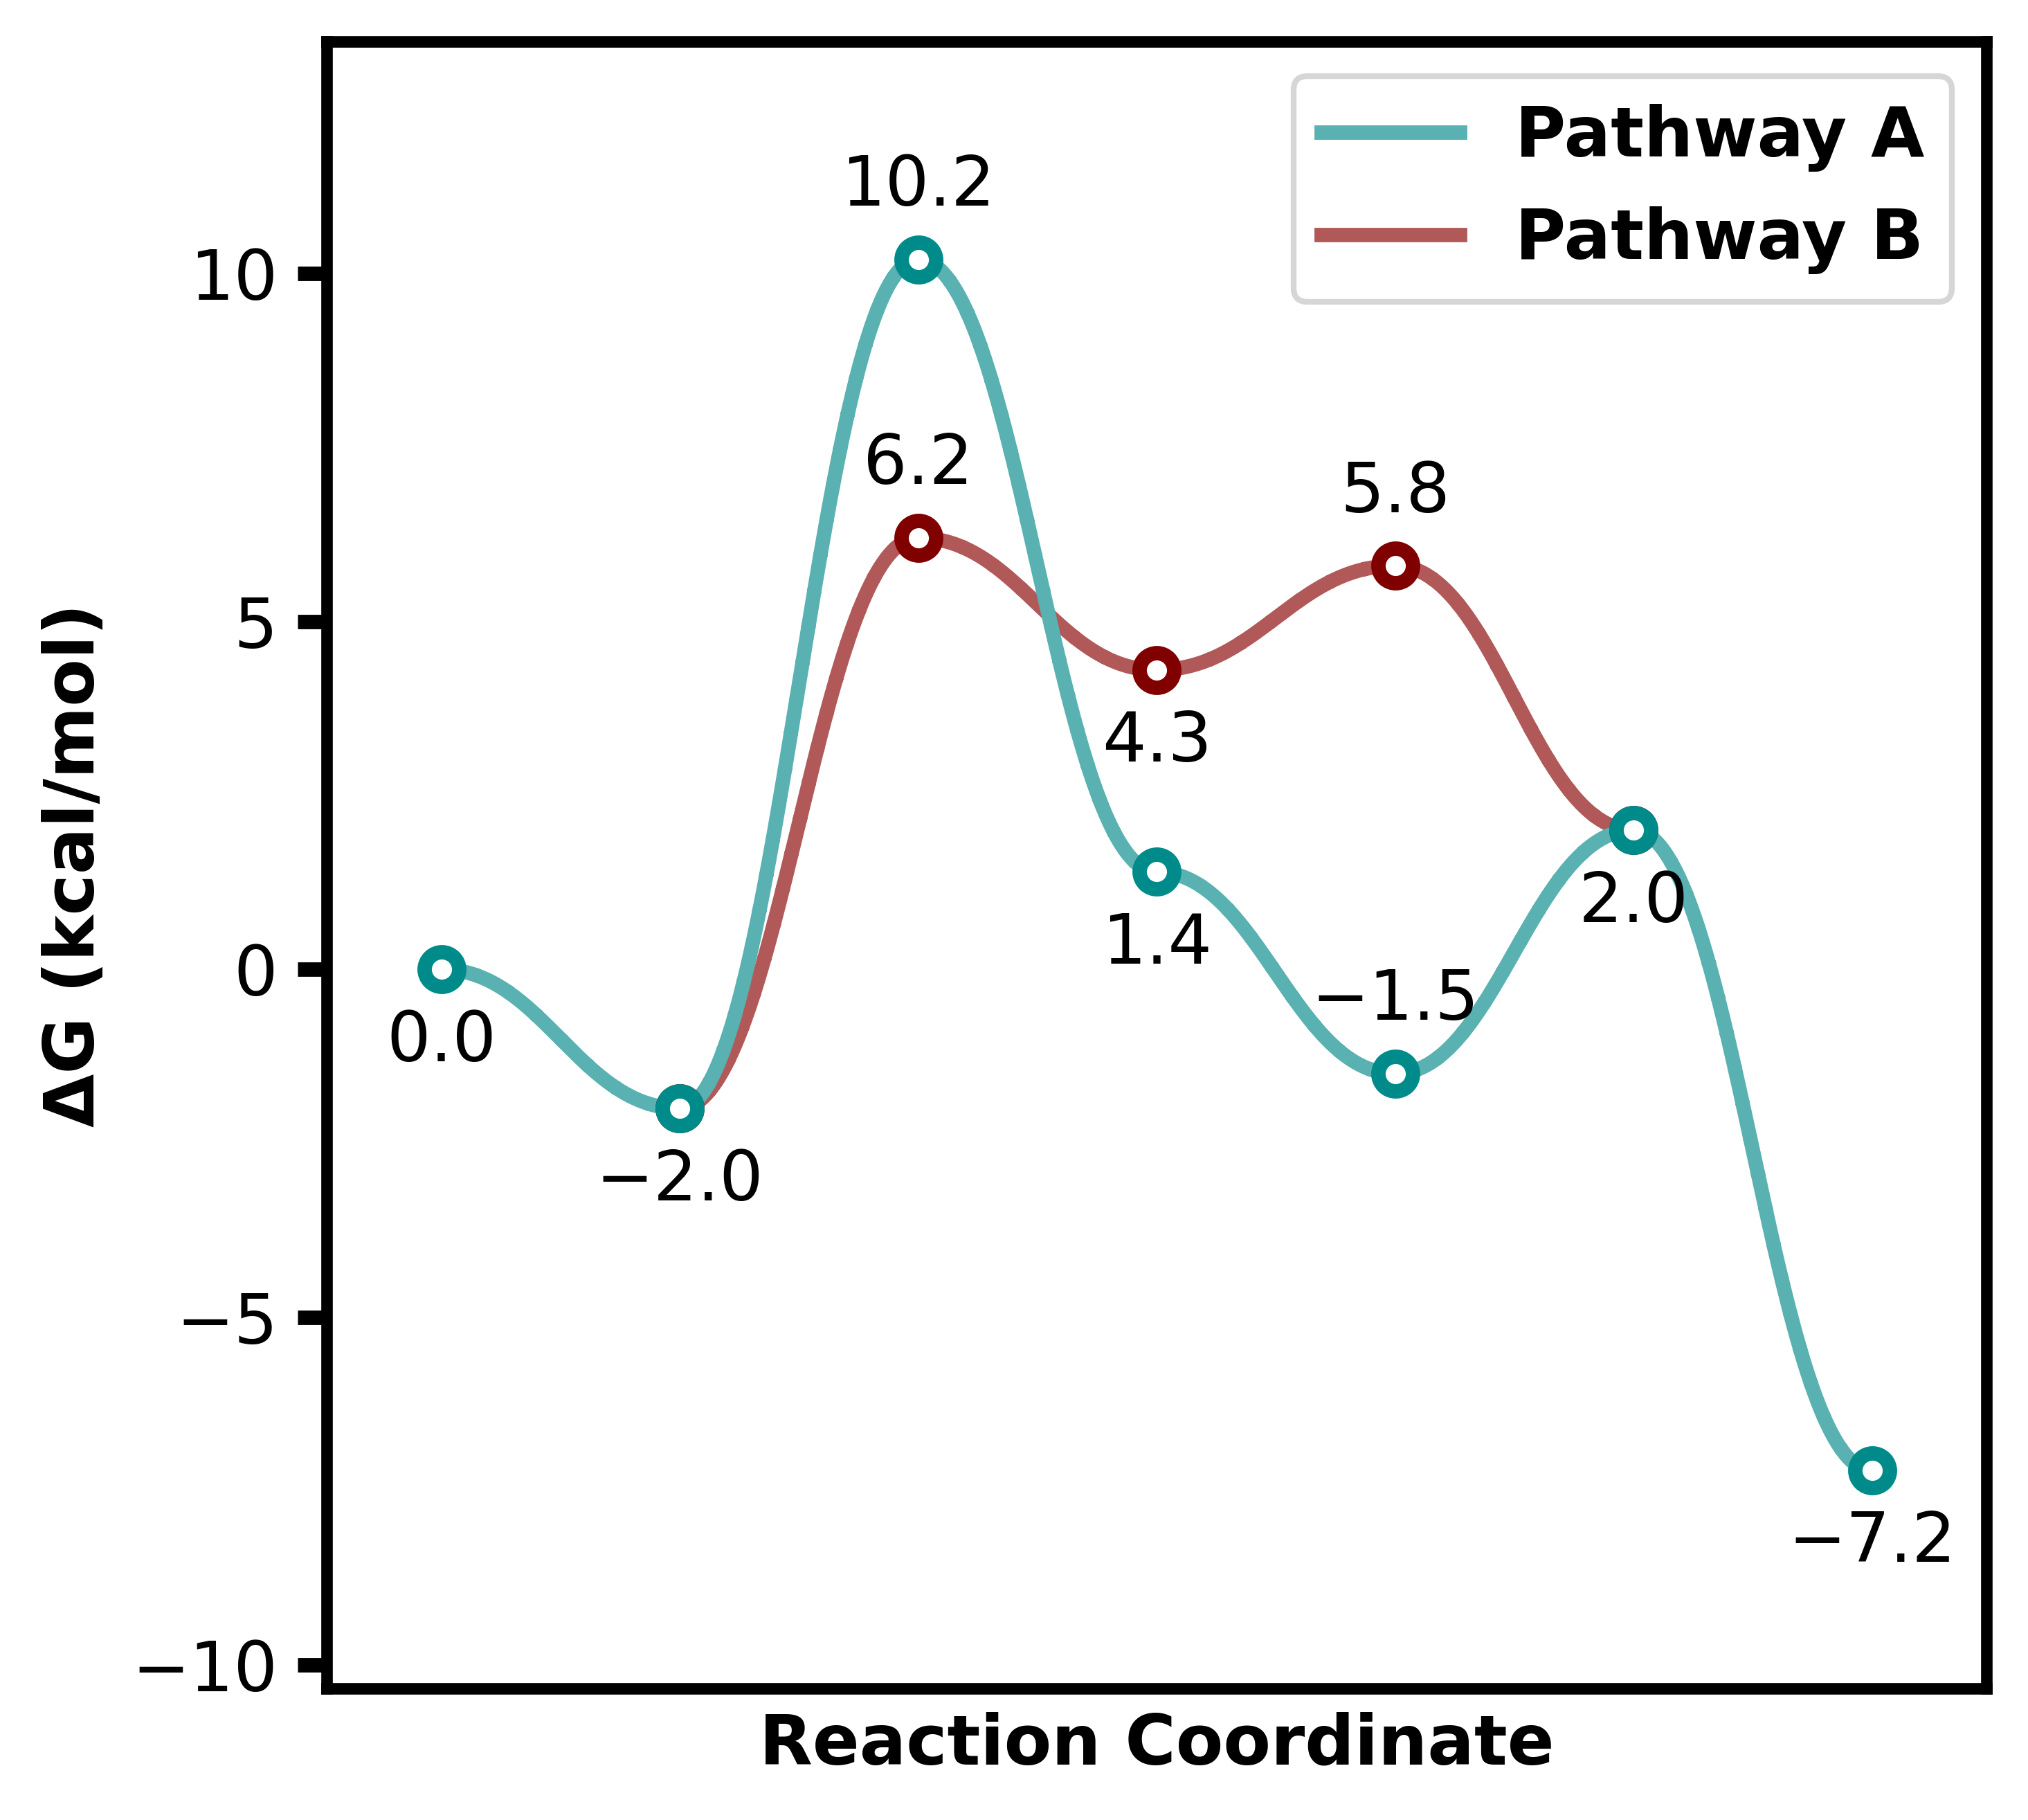
Plot publication-quality reaction profiles from computed energies: multiple pathways, isolated transition states, segment annotations, and a secondary axis for quantities that share the reaction coordinate.

Quick Example
from plotprofile import ReactionProfilePlotter

energy_sets = {
    "Pathway A": [0.00, -2.0, 10.2, 1.4, -1.5, 2.0, -7.2],
    "Pathway B": [None, -2.0, 6.2, 4.3, 5.8, 2.0],
}

plotter = ReactionProfilePlotter()
plotter.plot(energy_sets, filename="../images/profile0")