Plotting Behaviour
This section demonstrates how to manipulate the reaction profile plotting beyond aesthetics: controlling x-axis positions, skipping points, starting later, finishing earlier, or placing individual points between indices.
1. Point repeated for spacing
Sometimes you want a point placed between two x-indices. This can be done by repeating the same energy value in consecutive positions.
Example:
from plotprofile import ReactionProfilePlotter

energy_sets = {
    "Pathway A": [0.0, 5.0, 5.0, 2.0],  # repeated 5.0 creates midpoint
    "Pathway B": [0.0, 3.0, 1.0, 4.0],
}

plotter = ReactionProfilePlotter()
plotter.plot(energy_sets, filename="images/behaviour1")

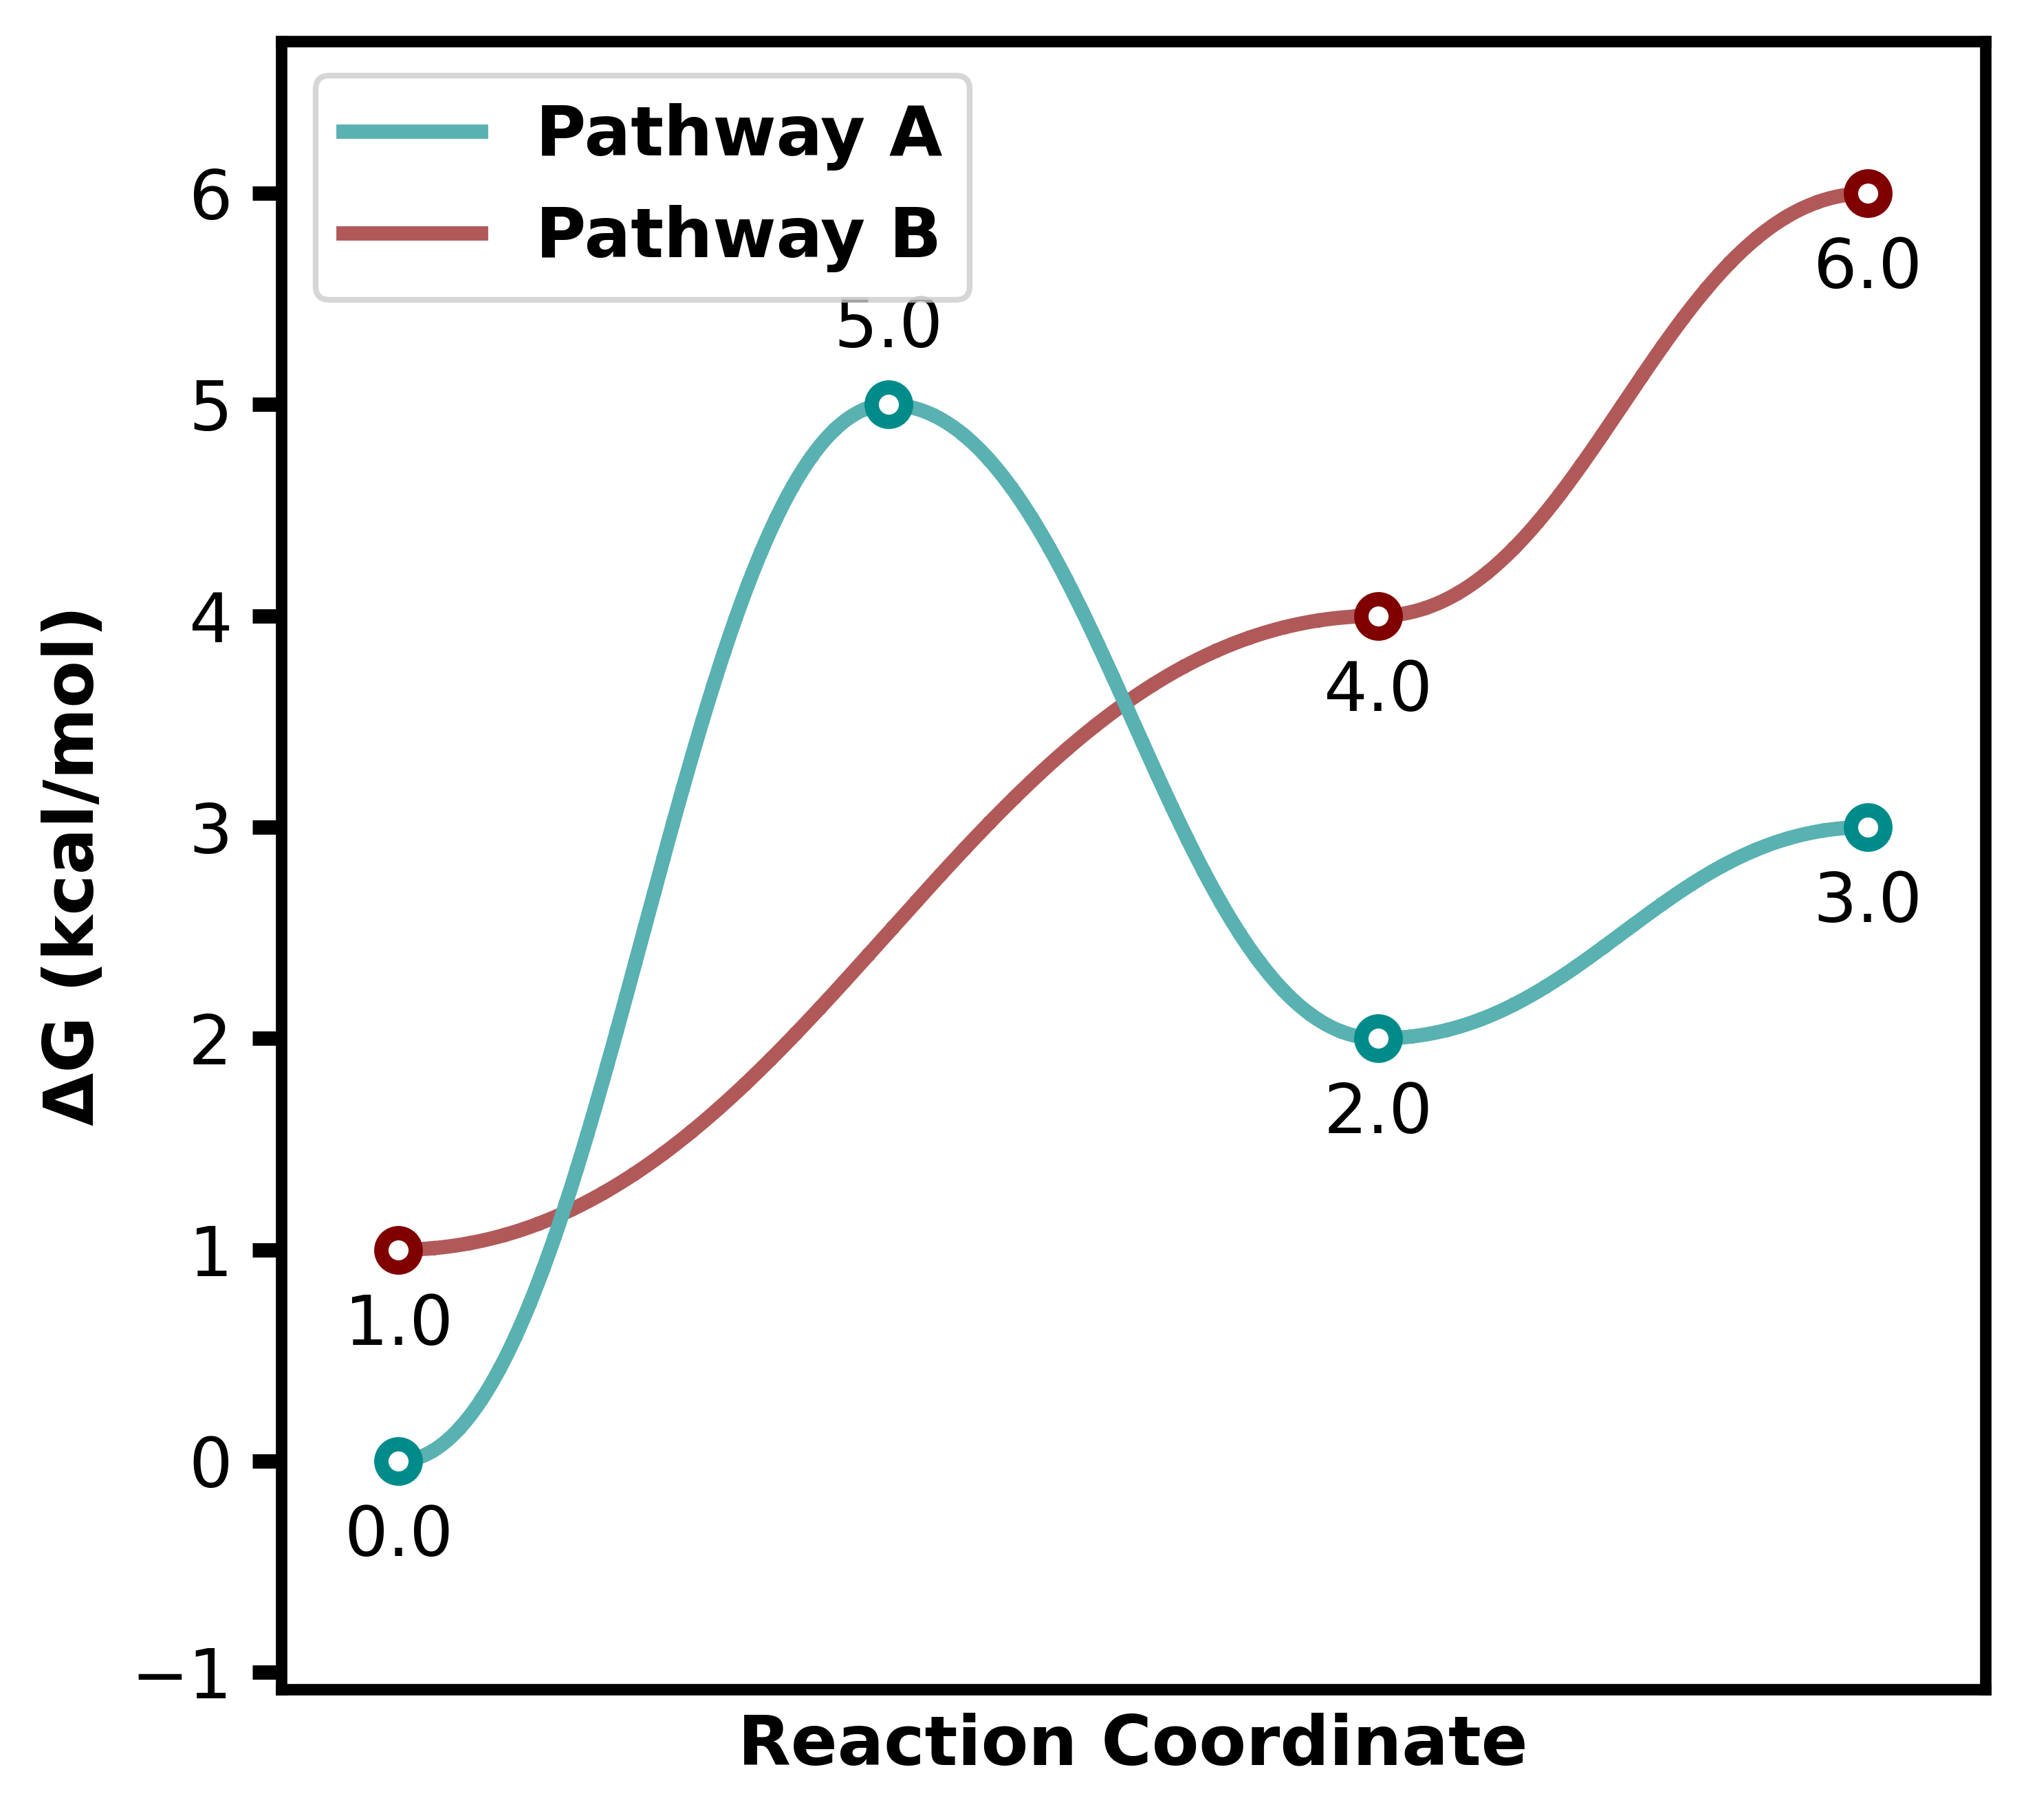
2. Skipping an index
You can skip an index by inserting None in the energy list.
The line will connect non-None values automatically.
Example:
energy_sets = {
    "Pathway A": [0.0, 5.0, 2.0, 3.0],
    "Pathway B": [1.0, None, 4.0, 6.0],
}

plotter = ReactionProfilePlotter()
plotter.plot(energy_sets, filename="images/behaviour2")
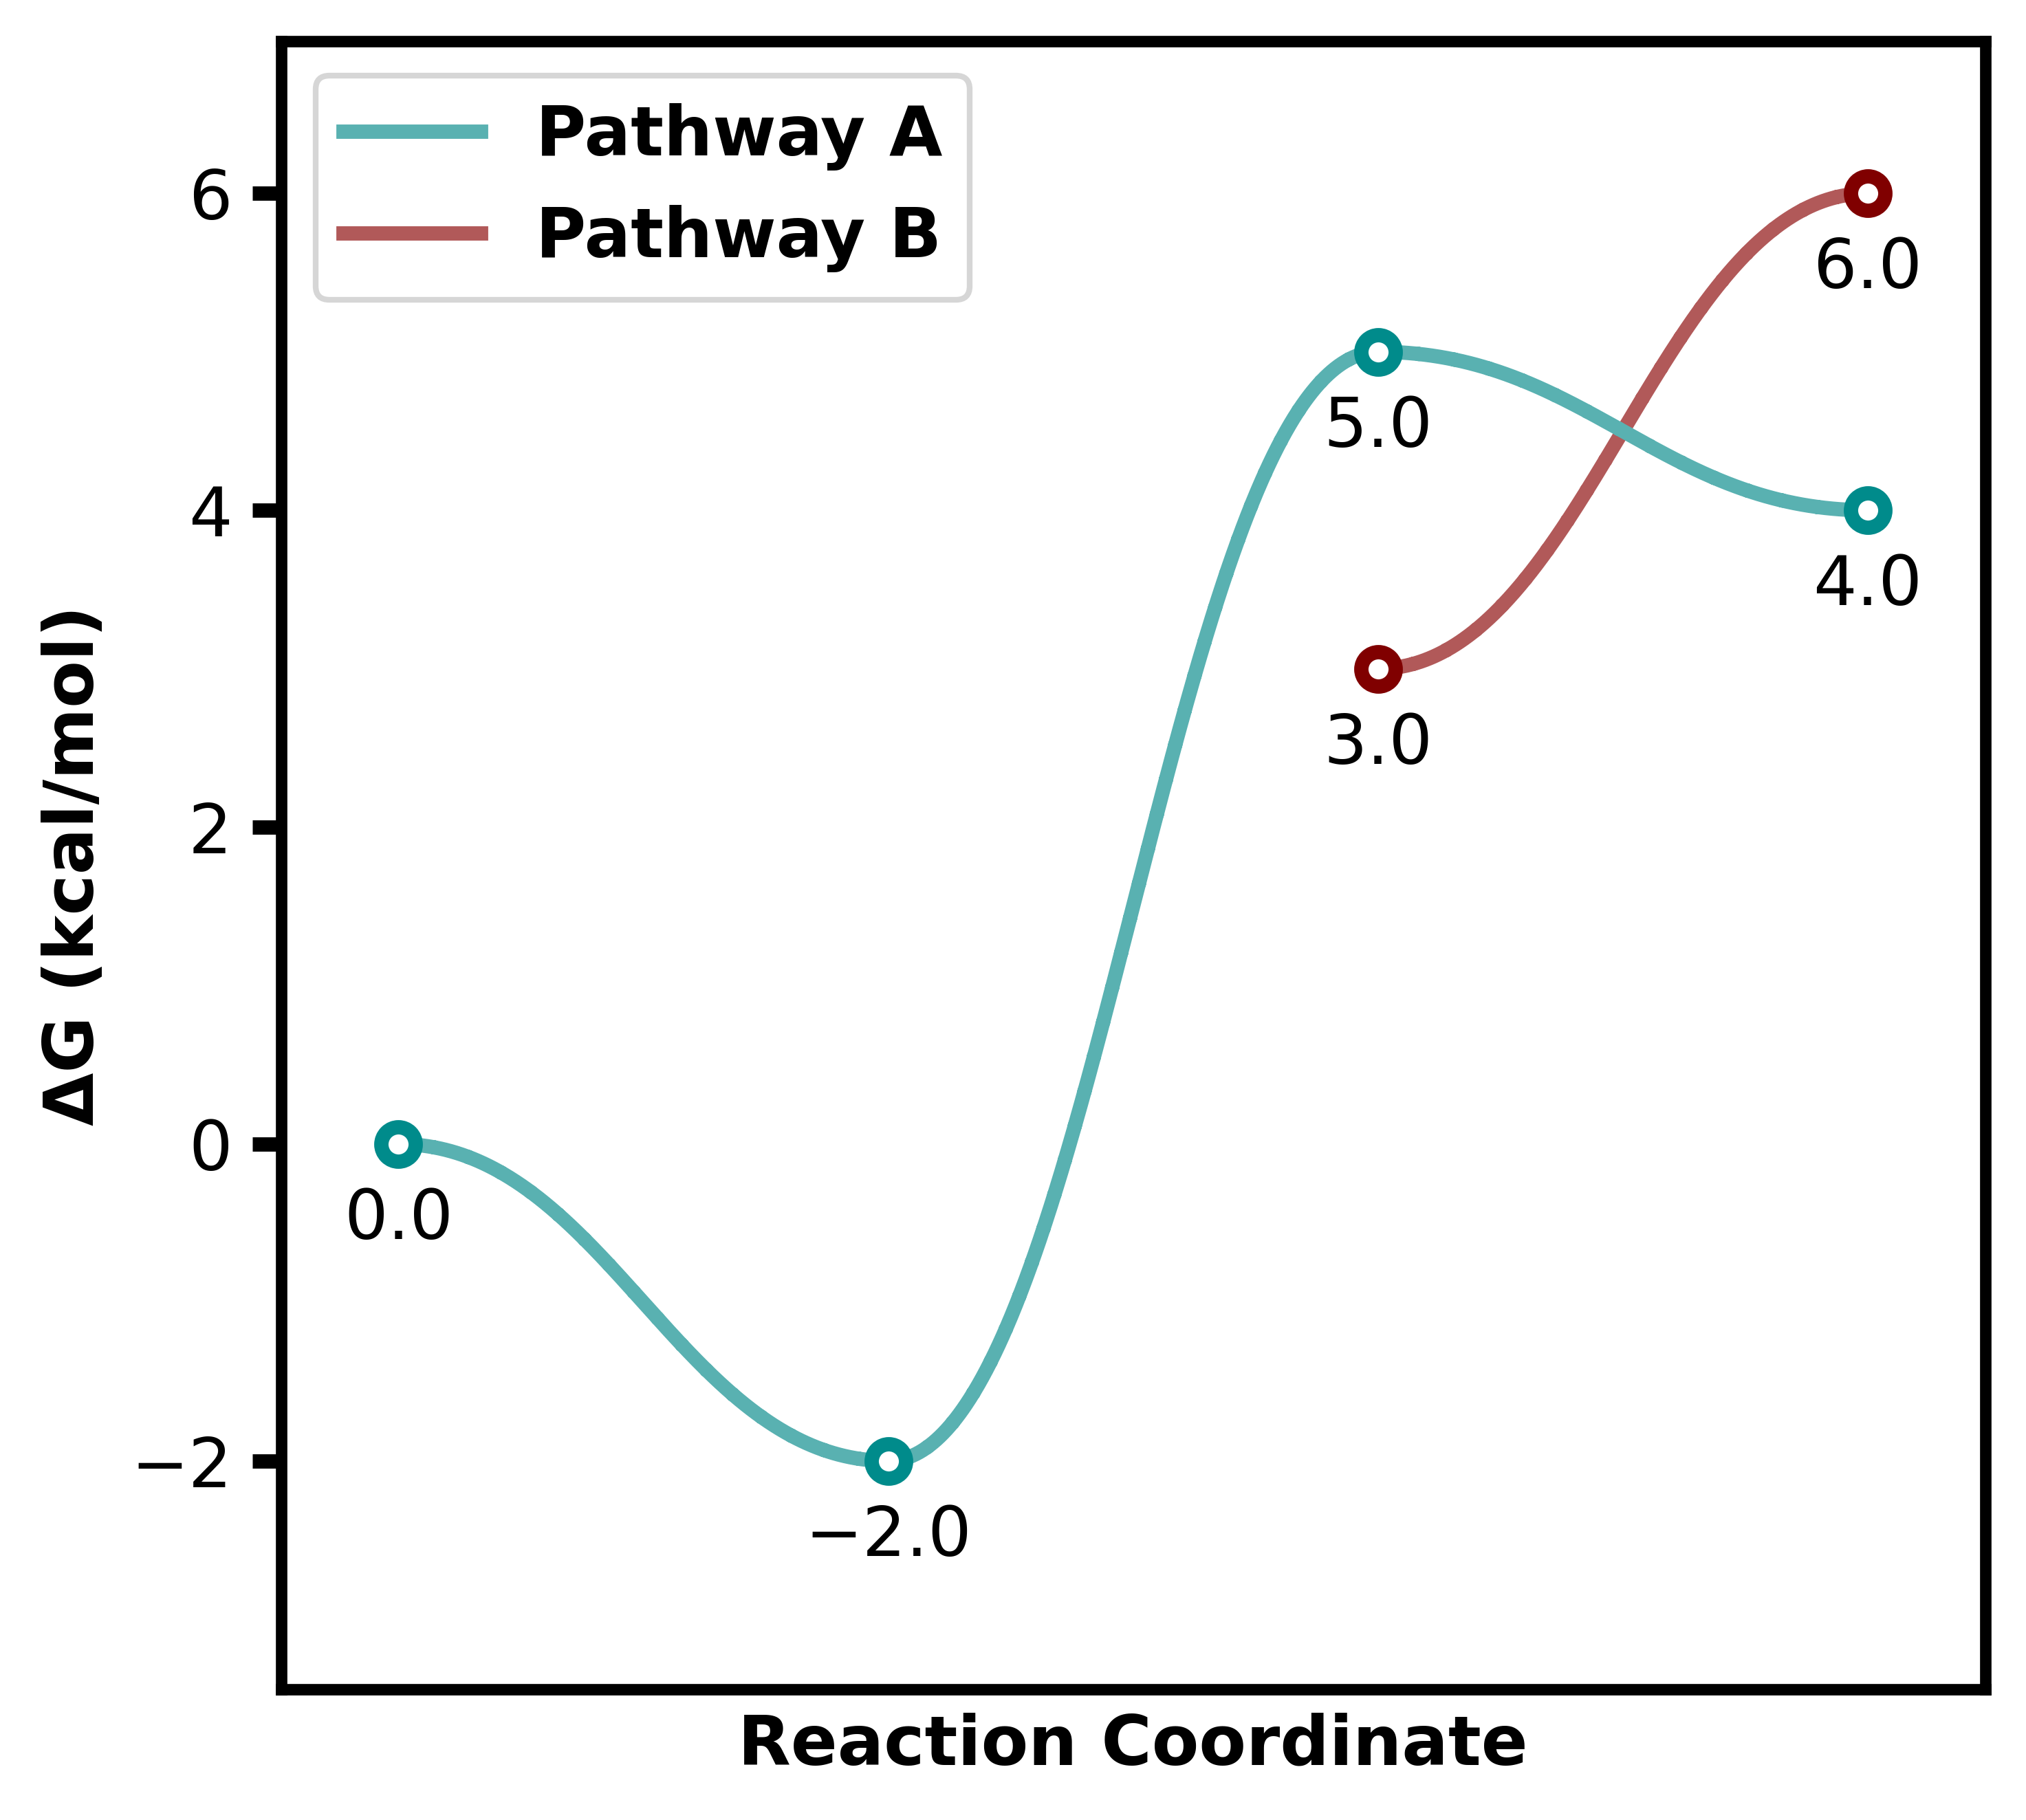
3. Starting later
A secondary curve can start after the first point. Place None in
all preceding positions.
Example:
energy_sets = {
    "Pathway A": [0.0, -2.0, 5.0, 4.0],
    "Pathway B": [None, None, 3.0, 6.0],
}

plotter = ReactionProfilePlotter()
plotter.plot(energy_sets, filename="images/behaviour3")
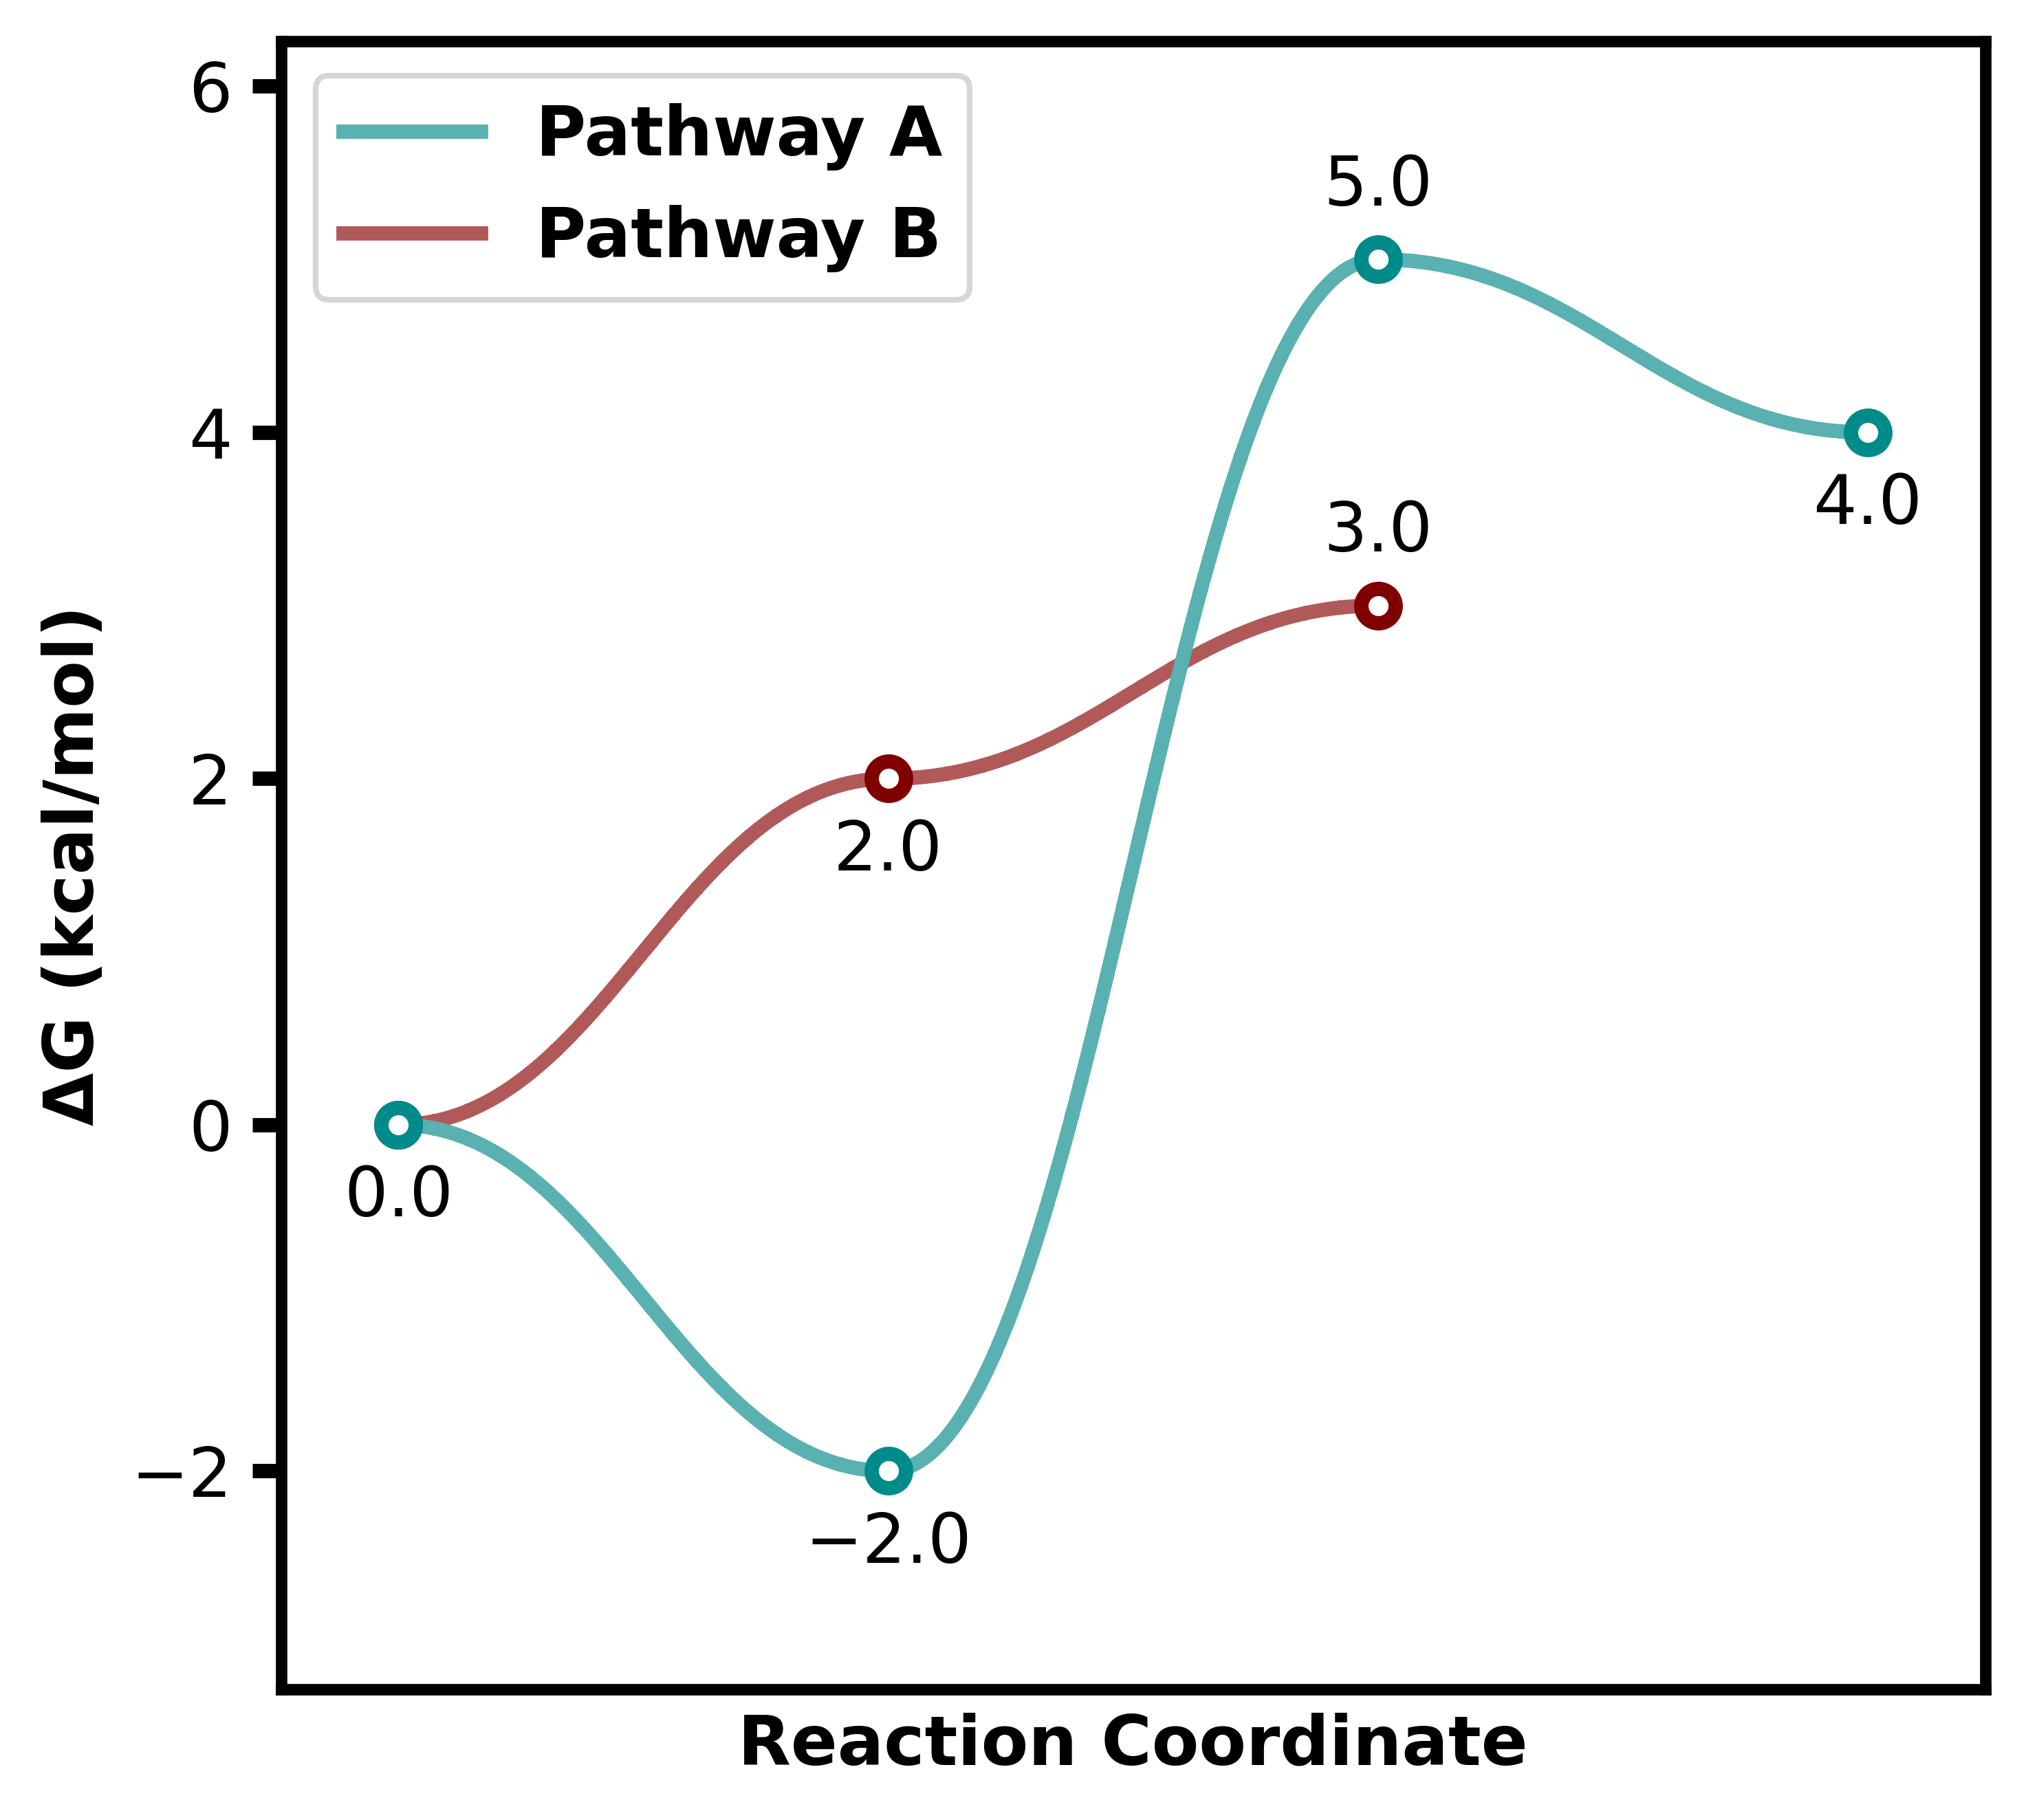
4. Finishing earlier
If you want a curve to finish before the last index, just end the list before the other series.
Example:
energy_sets = {
    "Pathway A": [0.0, -2.0, 5.0, 4.0],
    "Pathway B": [0.0, 2.0, 3.0],  # ends earlier
}

plotter = ReactionProfilePlotter()
plotter.plot(energy_sets, filename="images/behaviour4")
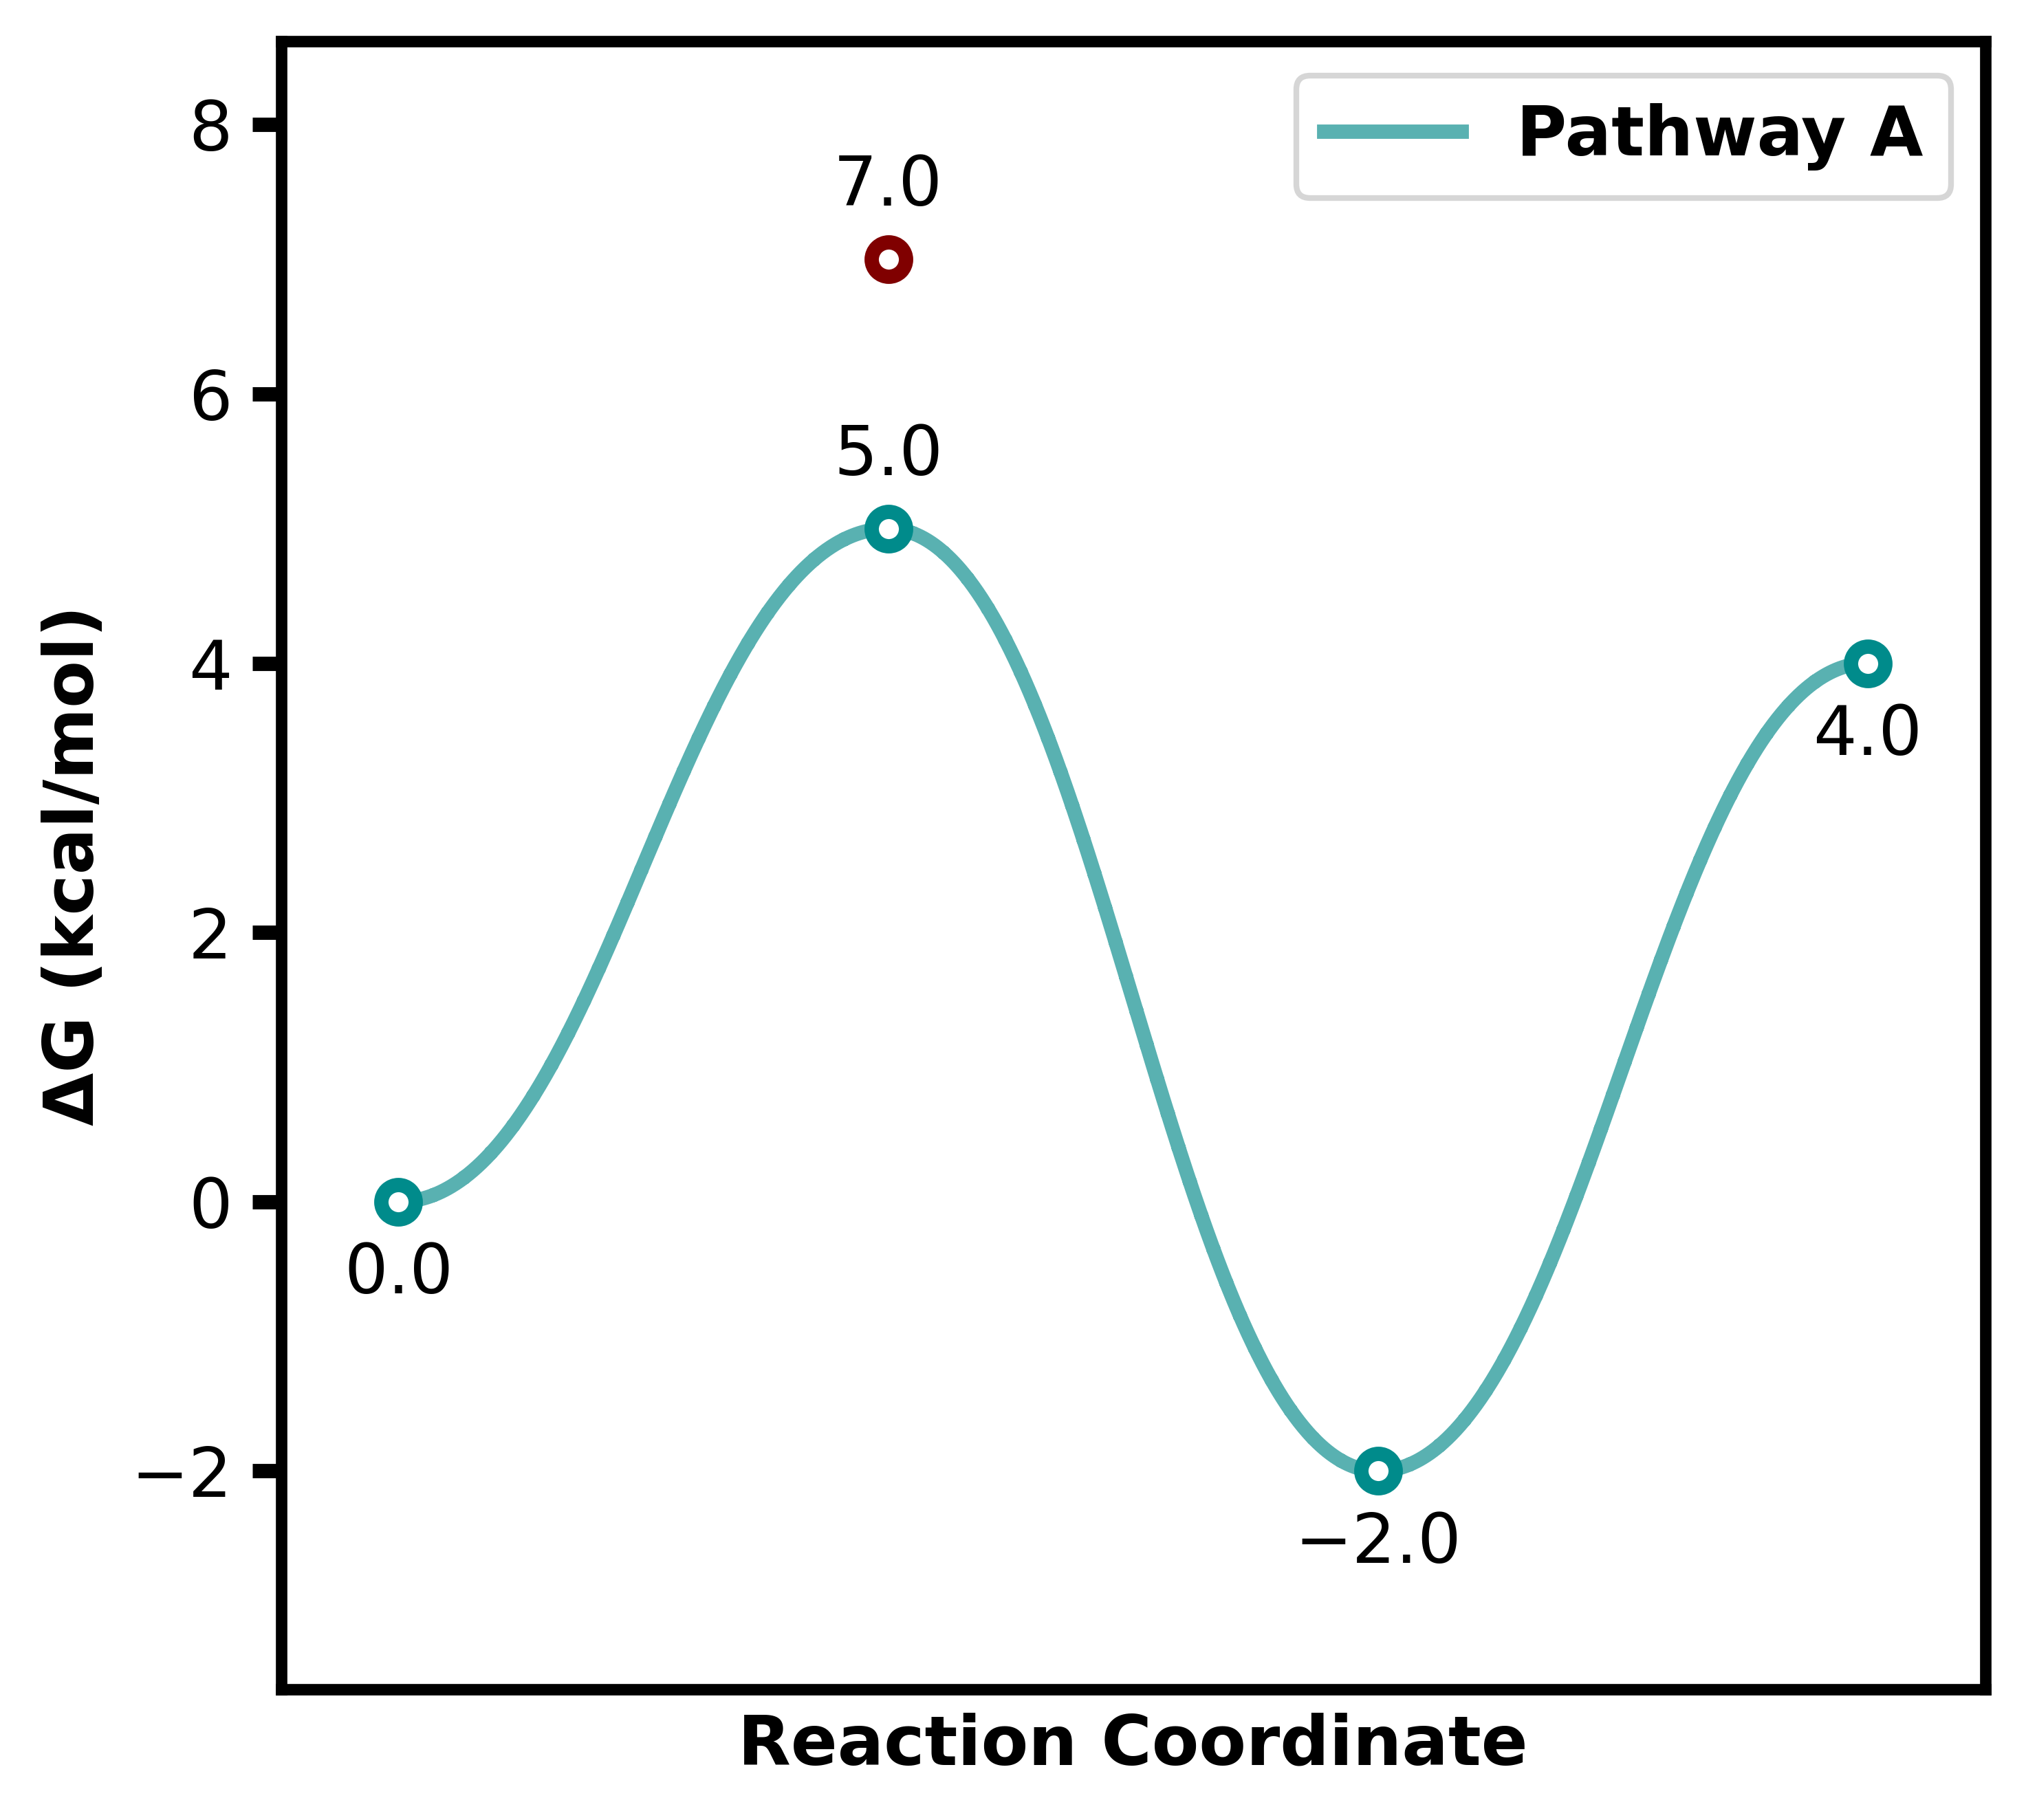
5. Single isolated points
Individual points can be placed by providing a list with only one
energy value or surrounding None.
Example:
energy_sets = {
    "Pathway A": [0.0, 5.0, -2.0, 4.0],
    "TS1": [None, 7.0],
}

plotter = ReactionProfilePlotter()
plotter.plot(energy_sets, filename="images/behaviour5")